You want an easy way to graph your real-time, remote sensor data on your own webpage?
This tutorial shows you how easy it is to use Valarm Sensor APIs and the NVD3 JavaScript API to do exactly that!
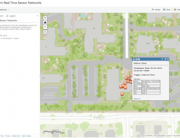
Note: if you haven’t already seen it, be sure to follow our other Valarm API tutorial with source code teaching you how to bring real-time sensor data onto maps using the Esri ArcGIS JavaScript API.
In order to set up your Valarm APIs, see this blog post and video to learn how you configure Valarm’s APIs for JSON, KML, CSV, and GeoRSS. See this blog post for setting up Device Groups with the Valarm APIs.
Have a look at out our API Docs to learn more about Valarm Tools Cloud’s APIs.
You have two options for how you can use the Valarm API:
- Latest – returns however many of the most recent alerts you’d like or
- Query – allows you to specify begin and end dates for your sensor data as well as which sensors you would like the API feed to contain.
Once you have your Valarm API URL you can graph your real-time sensor data on your website by using a jQuery AJAX call to Valarm’s cloud servers. Then we’ll make a graph with the sensor data received via JSONP from Valarm Tools Cloud. Note that Valarm is compatible with 1000s of different sensors so you can literally monitor anything wherever it may be, e.g.:
- Any Yoctopuce 4-20mA, electrical resistance, or 0-10V compatible sensors
- Water monitoring solutions + systems
- Volatile organic compounds (VOC) air quality
- Water depths / levels
- Geo-enabled, mobile, real-time environmental monitoring
- GPS / location
- Water flow + usage
- Tank monitoring
Click here for all of the HTML source code for this demo tutorial.
You’ll see in the source code we use the Valarm Tools Cloud API to get the latest 100 sensor data values then graph them using NVD3. In this demo tutorial we’re using data from a WiFi sensor hub connected to a meteo sensor that measures ambient temperature & relative humidity. Use your web browser to view this HTML5 + JavaScript source code (Alt/Option + Command + U with Mac / Apple OS X in Google Chrome browser).
Here’s a quick and easy summary with a few of the key code snippets:
//Use Valarm Tools Cloud JSON API to get latest sensor data!
$.ajax({
  url: "http://tools.valarm.net/api/public/device/
        55145b39e4b06add4744e6f9/latest.json?limit=500&callback=?",
  async: false,
  dataType: "jsonp",
  success: function(data) {
    for (i = 0; i < data.events.length; i++) {
      //do checks for valid sensor data from Valarm sensor monitoring device
      if (data.events[i].weather && isANumber(data.events[i].weather.tmp)
          && data.events[i].weather.hum != 0) {
        temperatureSensorValues.push({x: data.events[i].tsRaw,
          y: celsiusToF(data.events[i].weather.tmp)});
        humiditySensorValues.push({x: data.events[i].tsRaw,
          y: data.events[i].weather.hum});
      }
    }
   drawGraph();
  }
});
//Valarm.net sensor data generator / prepper for NVD3 format
function prepValarmSensorDataForNVD3() {
  return [
  {
    values: temperatureSensorValues,
    key: 'Valarm.net Temperature Sensor (In F)',
    color: '#ff7f0e'
  },
  {
    values: humiditySensorValues,
    key: 'Valarm.net Humidity Sensor (%)',
    color: '#7777ff'
  }
  ];
}
//Configure the graph axes and draw / plot the sensor data!
function drawGraph() {
  nv.addGraph(function() {
    var chart = nv.models.lineChart();

    chart.xAxis
      .axisLabel("Time (In UTC)")
      .tickFormat(function(d) {
      return d3.time.format.utc("%m-%dT%H:%M")(new Date(d))
      });

    chart.yAxis
      .axisLabel("Valarm.net Temperature (In F) + Humidity (%) Sensors")
      ;

    d3.select("svg")
      .datum(prepValarmSensorDataForNVD3())
      .transition().duration(500).call(chart);

    nv.utils.windowResize(
      function() {
        chart.update();
      }
    );

    return chart;
  });
}
Below are screenshots from the demo tutorial page of the Valarm sensor data in a NVD3 graph!

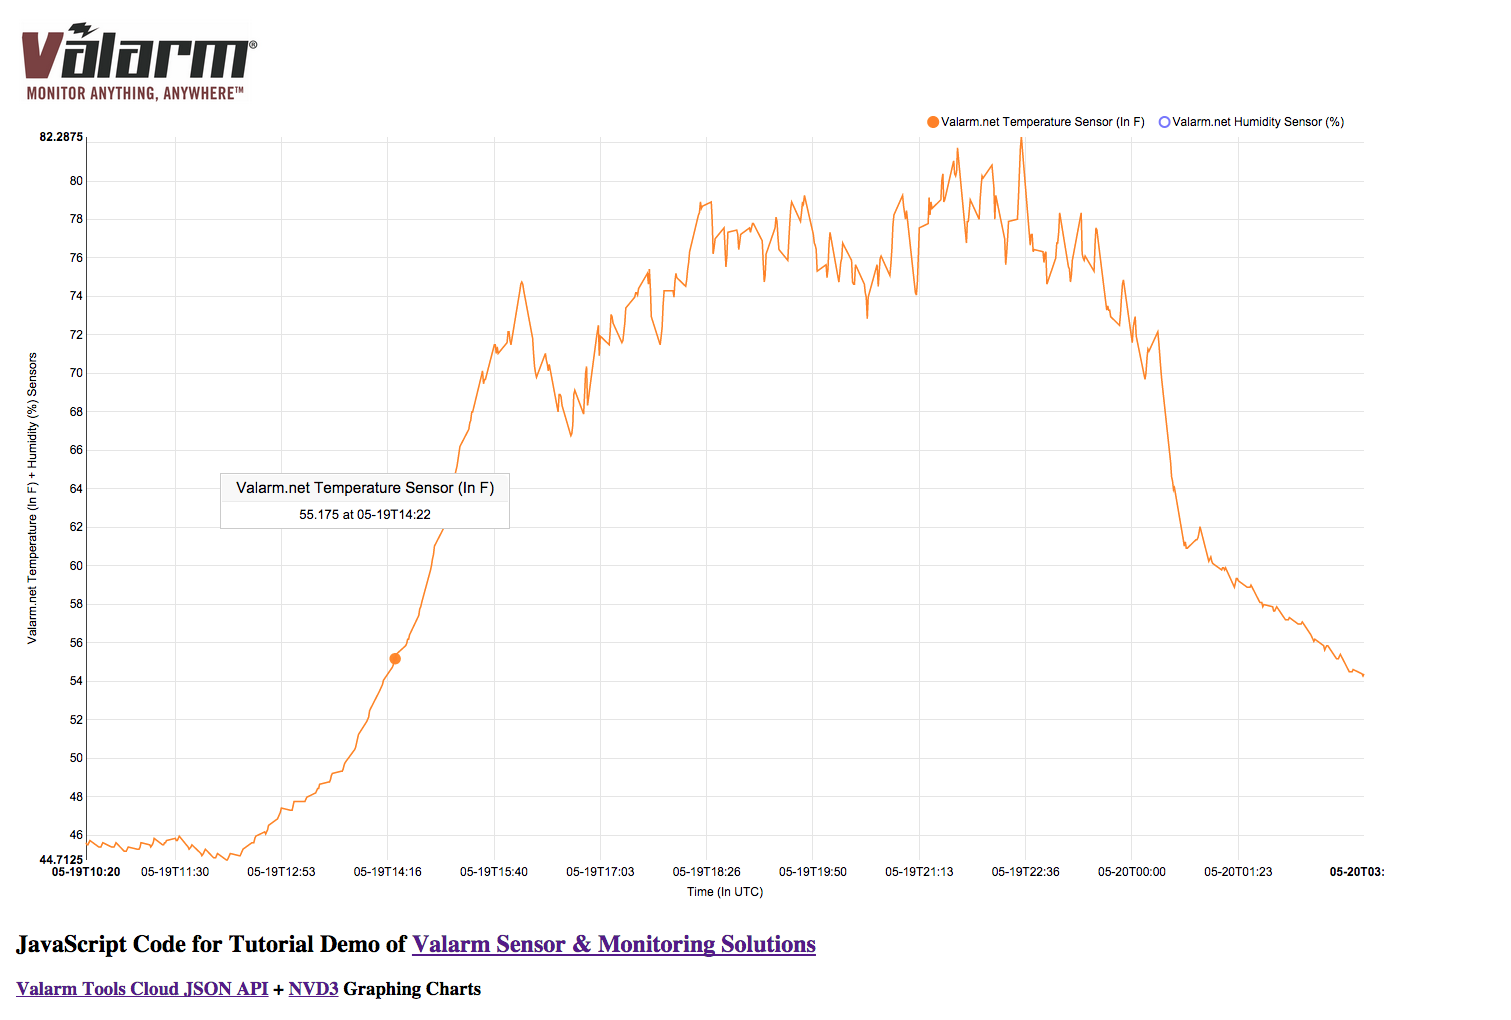
Modify the code and use your Valarm sensor data feed from Tools.Valarm.net. Learn more about NVD3’s awesome graphs and charts then customize the page however you want.
Change the code to point to your Valarm sensor data and feel free to customize the webpage to your liking. Change the logo to your own, add your sensors, other graph styles, and automatically update / refresh to get your most recent sensor data from Valarm Tools Cloud.
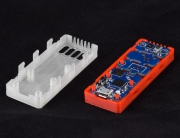
You can use a Valarm Connector Device like a WiFi Sensor Hub or Ethernet Hub to get your sensor data into the Valarm Tools Cloud.
Please don’t hesitate to contact us if you have any questions.