The step-by-step instructional video here shows you how to use Industrial IoT sensor and environmental monitoring solutions with light sensors and Tools.Valarm.net.
Here’s what you’ll need to do this:
- Your sensor hubs and sensors and hardware are available at Shop.Valarm.net
- Your real-time Valarm sensor data is available at Tools.Valarm.net for mapping, graphing, downloading, and forwarding using Your Industrial IoT APIs for JSON, KML, GeoRSS, and CSV
Voiceover / Video Transcript:
Hello, my name’s Edward. I’m the president of Valarm. In this video you’ll see how to use Valarm for remote environmental monitoring. There are thousands of sensors compatible with Valarm monitoring solutions. In this video we’ll focus on light sensing.
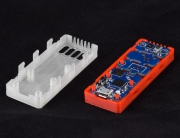
What you’re seeing here is a Valarm compatible Yoctopuce light sensor. Perhaps you’ve got some plants, a chemical processing plant, gases, vehicles, or something else you’d like to remotely monitor with sensors. With Valarm, you can literally monitor anything, anywhere. As you’ll see in this video, using the Valarm Pro Android mobile app and Yoctopuce USB sensors you have affordable, real-time, mobile sensors to perform remote environmental monitoring.
In this demo setup you see a Sony Android device running the Valarm Pro app, a Yoctopuce USB light sensor, and a Valarm OTG + Charging Y-cable that allows an Android device to talk to external sensors at the same time as charging.
To set up the light sensor, launch the Valarm Pro app and use the menu button to go to All Settings then Yoctopuce, then Meteo and Light. Be sure to Enable Yoctopuce sensors at the top of the screen if you haven’t already then you can click Scan All to verify all of your sensors are properly connected. Scroll down on this screen to see the light sensor settings, where you can set hi and lo threshold values using the sliders. You see our test sensor scan reported a light value of 262 lux. Now I’ll cover the light sensor and scan again to see the change. Now we see I’m getting a current light sensor value of 0 lux. Be sure to turn on the light sensor by clicking the box next to it so that sensor values are uploaded to the Valarm Tools Cloud website.
Now I’ll go back to the All Settings screen and turn on the interval timer. This tells Valarm to gather all sensor values at the custom time interval you set, for example, every 30 seconds or every hour.
Our last step is to turn on Valarm Web Integration and link the device to the tools.valarm.net website. Then we’ll be able to map, graph, analyze, and download all of our sensor data from the Valarm Tools Cloud. This device has been configured to report sensor values to the cloud in real-time. For step-by-step instructions on how to do this, watch Valarm’s YouTube video tutorial on linking devices to the web.
We’ve got everything configured, now we’re ready to arm Valarm by clicking Arm on the app’s home screen. Now that Valarm has been deployed and armed, the sensor data is being sent in real-time to the Valarm Tools Cloud website using the Android device’s internet connection: 3G/4G cell network, WiFi, or any other connection. I’ll affect the light sensor readings here by placing by hand over the light sensor and by shining a flashlight on the light sensor.
At the same time you can see your Valarm sensor data on any computer connected to the internet by going to the tools.valarm.net website. Login to your Valarm Tools Cloud account, or register a new one if you don’t have one yet. Once you’re logged in go to the Device Manager and click your Valarm device to see the device details and the latest geo-tagged sensor data. Here you’ll see the latitude and longitude coordinates associated with every sensor reading, in this case you see sensor data collected every 2 seconds.
Click graph sensors then select your sensors of interest to see an interactive graphic of your sensor data. Hover your mouse over the graph to see exact values at that point.
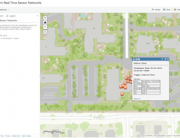
Using the Esri ArcGIS Tools you can see your geo-tagged sensor data on a map. Here I zoomed in to our light sensor demo dataset and when you click on a point you’ll see all of the sensor data collected at that point. In this case each point is an interval timer reading performed every 2 seconds. All Valarm sensor data is geo-tagged with latitude / longitude coordinates using the device’s GPS.
Now you know how to use Valarm’s real-time, mobile sensors for remote environmental monitoring, so get out there and do it! Don’t hesitate to contact us if you have any questions, comments, or suggestions for another video at info@valarm.net.


