When our customers are monitoring sensors with Tools.Valarm.net, they need to analyze measurements to save money and time for their businesses.
In this blog post, you’ll see a video overview of an Industrial IoT software feature available on Valarm Tools Cloud.
Your Quick Stats features gives you, your teams, and your organization an easy, rapid way to effectively perform analytics on your remote monitoring systems.
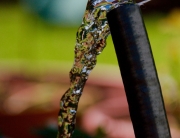
Whether you’re monitoring water, air quality, fluid levels, flood warning systems, or anything else, these quick stats give you real-time information about your sensors over any time period. You’re provided with situational awareness by knowing mathematical factors like:
- Maximum Sensor Measurements Over Any Time Period
- Minimum Sensor Measurements
- Average Sensor Readings
- Standard Deviation
Watch the video up top. After you watch the video, let me know if you have any questions – Info@Valarm.net.
Video voiceover / script:
Howdy, this is Edward from Valarm.
In this video you’ll see an overview of the quick stats function from Tools.Valarm.net. This will give you a glimpse of how to perform Industrial IoT Sensor Analytics on Valarm Tools Cloud.
Remember to click the subscribe button down below to subscribe to our Youtube channel and help the youtube algorithm.
You, your teams, and your organization can monitor and manage your remote monitoring systems with Tools.Valarm.net .
To get started, make sure you’re looking at your Device Manager after you log in to your Valarm Tools Cloud account.
Click the name of your device you’d like to use for seeing what Quick Stats does for you.
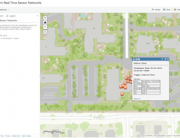
On your device details page you’ll see a button called Quick Stats on the left side under Tools. The red arrow in this video is pointing right to where you’ll click.
Make sure you’ve set up custom column names and sensor field aliases. If you haven’t already done this then check out our blog posts on Valarm.net that’ll show you how to do that.
After you click your Quick Stats button you’ll see … that’s right, you probably guessed correctly, you’ll now see your a rundown of statistics for your device. This includes a breakdown of each sensor variable for your device, for example, water levels, temperature, or water quality. You’ll see the current time range you’re looking at, when the first and last IoT sensor events are. And you’ll see the maximum, minimum, average, and standard deviation for each of your sensor field measurements.
Waa-laa, you’ve seen magic happen.
That’s your overview of the quick stats feature on Valarm Tools. This gives you an easy way to get a feel for what’s going on with your IoT sensor devices and monitoring equipment in the field.
If you’ve got any questions then don’t hesitate to get in touch with me at Info@Valarm.net. Our customers use Tools.Valarm.net to monitor anything, anywhere.
Whether you need to monitor flood warning systems, air quality, water wells, flow meters, smart cities, water quality, or anything else, we’re here to help you, your teams, and your organization to save your time, and your money.
Thank you for watching, and don’t forget to click the subscribe button down below to get the latest info on monitoring Industrial IoT sensors.