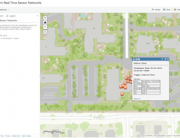
Our customers use Industrial IoT dashboards to remotely monitor valuable assets with any device that has a web browser, like a phone, tablet, laptop, or desktop.
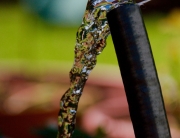
From water wells and flow meters, to tank levels and flood warning systems, our dashboards are custom tailored for our customer’s particular needs specific to each IoT sensor monitoring system.
This blog post is about how to customize your Valarm dashboard. Specifically, we’ll go over how you can edit, swap, and set up your channel and IoT device IDs / identification codes.
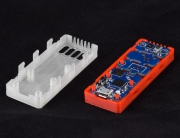
When an Industrial IoT Device is added to your Valarm Dashboard, it requires two “codes” to be pasted in from the Tools.Valarm.net website.
One is the [DeviceID_APIKey] (this is the same as the “Routing Code” pasted into Yoctopuce devices during initial configuration)
The other is the ID of a Custom Column Layout that will return the appropriate data columns with the names expected by the various Dashboard templates (including homepages).

The Column Layout ID is the key to editing or swapping Industrial IoT sensor devices, like flow meters, in your real-time web-based dashboard. You can edit it at any time.
Before doing this, make sure you’ve already built custom Column Layouts / alias nicknames on Tools.Valarm.net.
In your List of “Show Columns” you’ll see custom column configurations created to facilitate web dashboards.
On Tools.Valarm.net, pull up your Industrial IoT Device in question, and select the Custom Column Layout that maps the columns you want into the names expected by the Dashboard template.
Then copy to the clipboard the ID of that Column Layout.

Then in the dashboard, paste that Column Layout API ID into the “Channel Map ID”.

For future exploration with your own tools, here’s a version of the API call that the Dashboard makes, to see the data for only flowmeter #1 on BY136.
https://tools.valarm.net/api/v1/device/5f2xxxxxxxxxxxxxx8b5/query.json?&apiKey=OqxxxxxxxElzd&fromDate=2020-10-07+00:001&toDate=2020-10-08+00:001&columnLayout=5f6xxxxxxxxxxxxxx6f58&requestId=howdy&pretty=true
Note the “pretty=true” parameter at the end of the API URL above, which asks the Valarm Tools Cloud servers to format the JSON for you to read pretty simply instead of densely for the computer to save space and bandwidth. The results look like this:
{
  "events" : [ {
    "ts" : "2020-10-08T21:19:43.612Z",
    "totalizer" : 1130.85,
    "liters_per_second" : 0.0
  }, {
    "ts" : "2020-10-08T21:18:40.538Z",
    "totalizer" : 1130.85,
    "liters_per_second" : 16.39
  }
...
   ],
  "deviceId" : "5f2xxxxxxxxxx8b5",
  "deviceName" : "BY136",
  "requestId" : "howdy",
  "columnLayout" : "5f6xxxxxxxxxxf58"
}
That’s your introduction to some ways that you, your teams, and your organization can customize your Valarm dashboards.
We’re here and ready to help you install and monitor Industrial IoT sensor systems. Whether you’re monitoring water, tanks, wells, flood warning systems, or anything else, Tools.Valarm.net helps you save your time and money.
Send me a message at Info@Valarm.net if you’ve got any questions.