Do you, your teams, or your organization need easy-to-use, web-based dashboards to quickly show real-time sensor information from your remote monitoring systems?
Wild fires are common in California and around the world. 1 of our customers asked us to make a webpage including real-time wild fire risk on a map along with gauges and widgets with remote weather sensor data.
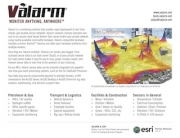
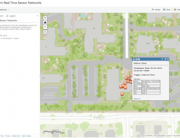
In the Web Dashboard screenshots you’re seeing web browser screen captures from the customer’s custom landing page (try saying that one 10 times quickly).
Each of the flag icons is a remote monitoring station collecting sensor data and uploading the environmental information to Tools.Valarm.net.

The Valarm JSON APIs are called via JavaScript for the web dashboards, and then visualized on Esri Arc GIS maps.
To help keep you and your community safe, your custom polygon colors to distinguish the areas with more immediate fire danger:
- Green – low wildfire risk
- Yellow – moderate fire danger
- Orange – high risk of wildfire
- Red – extreme fire danger
Note: Are you a video visual learner? Watch this video tutorial to learn how your organization can use Tools.Valarm.net software + Campbell Scientific sensor hardware for your remote monitoring needs.

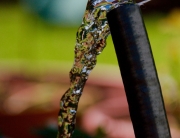
At each location there’s a Valarm box similar to what you see in the photos. The remote monitoring systems can be powered via any power source. The monitoring units send remote sensor data to Tools.Valarm.net via any internet connectivity. In this case the telemetry deployments are solar-powered, and send telemetry data to Tools.Valarm.net via AT&T‘s mobile cell network.
These Valarm monitoring boxes are deployed in Southern California where there’s a high risk of wildfire each year, so you’ll see that current fire conditions are a critical part of this web dashboard.
The latest wildfire risk sensor measurements are integrated to color the polygon areas on the Esri maps, which are also described at the top of each individual met station’s information page.
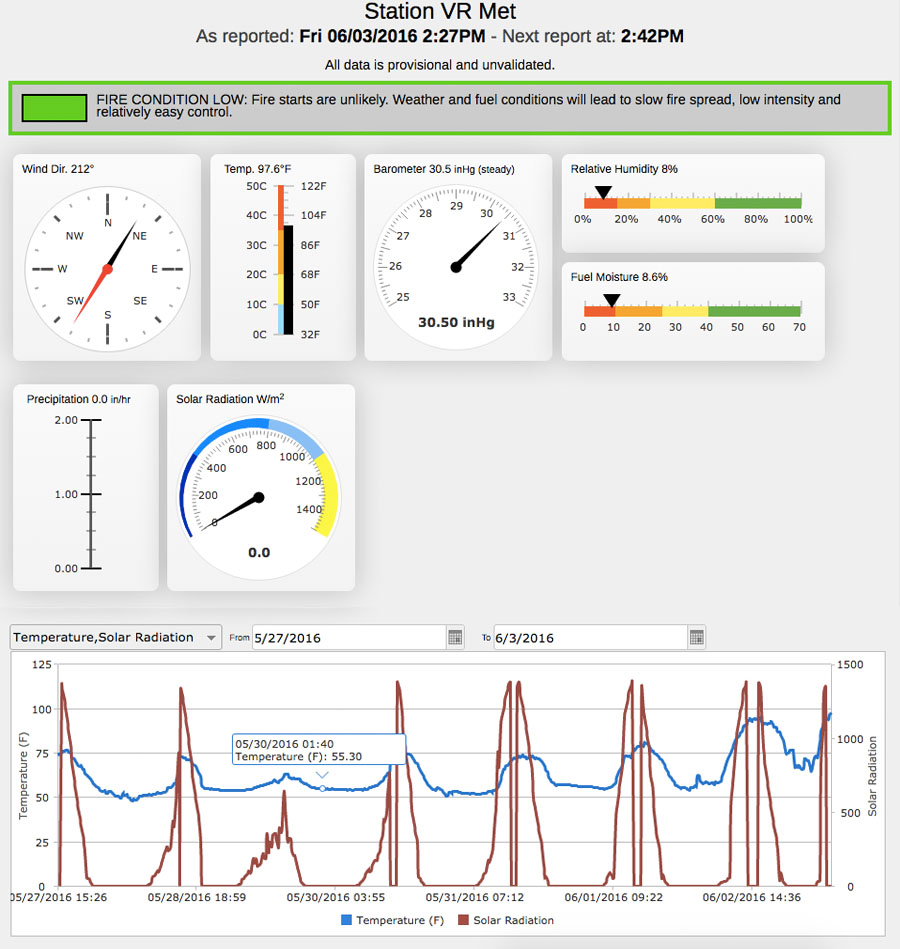
When you click a remote monitoring system on your map, you’ll see sensor telemetry info and the latest sensor measurements from that monitoring station. At these locations our customer is monitoring the following environmental factors:
- Fuel moisture (for wildfire risk)
- Precipitation (rain)
- Relative humidity
- Solar radiation
- Barometric pressure
- Temperature
- Wind speed
- Wind direction
 How can you do this? Please don’t hesitate to get in touch at Info@Valarm.net if we can be of service for advice, assistance, or anything else to help you, your teams, and your organization deploy your most effective monitoring systems.
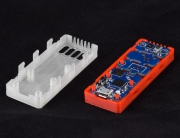
The critical components of these environmental monitoring systems are sensor hubs that connect to sensors from various hardware manufacturers.
In this case you’re seeing measurements from Vaisala and Campbell Scientific sensors (like the CS506-L fire fuel moisture sensor on the right) that are connected to CR1000 data logger units that send sensor measurements to Valarm sensor hubs. The sensor hub upload the real-time sensor information to Tools.Valarm.net.
Are you a video visual learner? Watch this video tutorial to learn how your organization can use Valarm + Campbell Scientific Data Logger solutions for your remote monitoring needs.


A key factor to note here is the open nature of Tools.Valarm.net. This means that you can upload your real-time measurements from sensors made by any hardware manufacturer, like Campbell Scientific, to the cloud, using your most convenient internet connectivity method. In some cases you might already have WiFi at the site so you can use that to save time and money for your organization, and not have any additional bandwidth data fees.
Or you can integrate a long range WiFi antenna and keep down your monthly costs that way, see this blog post write-up for more details on how to set up your own long range WiFi network. You can also use Valarm with ethernet, CDMA, Ingenu, or GSM cell networks.
Tools.Valarm.net is quite flexible, which means you really can use it to monitor anything, anywhere.
Quick Review / Summary
You can see each of the Valarm units on the Esri Arc GIS maps and when you choose a location you’ll see the latest sensor data and a graph with historical sensor data for your desired time range.
You’re looking at an example of this in the screenshot with historical, temporal graphs of temperature, humidity, fuel moisture, wind speed, and barometric pressure.
Tools.Valarm.net is an open and flexible platform – your remote sensor is updated as often as you’d like. For this customer new telemetry data is being sent to Tools.Valarm.net via GPRS / GSM mobile cell phone network every 15 minutes.
See some of the other Web Dashboards we’ve built for customers:
- Monitoring remote tank levels in real-time
- Water well monitoring – flow meter rates and water depths
- Monitoring industrial equipment, machinery, pumps, pressure, hydraulics, and temperatures
Also have a look at our additional Industrial Internet of Things / IoT Customer Success Stories that’ll tell you more about how Tools.Valarm.net is used by organizations in all industries – from natural resources and government agencies, to ground water well monitoring and flood warning systems.
¿Hablas español? Haga un click por aquí para leer este blog post historia en español castellano.
Questions?

Our customers monitor sensors made by various manufacturers like Flowline, Geokon, Clair Air, and Senix for telemetry, whichever hardware makes the most sense to use with our Tools.Valarm.net software.
We’re happy to help you, your teams, and your organization effectively monitor remote assets to save your time and money.

Whether it’s piezometers, water wells, tanks, levees, water levels & flood warning systems, vibrating wires under bridges, or anything else, we’ll work with you to deploy effective monitoring systems for your specific needs.
Please don’t hesitate to Contact Us at Info@Valarm.net if you or your organization need to remotely monitor anything, anywhere.