You’ve got a new software feature available on Tools.Valarm.net!
There’s now a Quick Stats button available for each of your Industrial IoT sensor devices that your organization is monitoring with Valarm Tools Cloud.
After you’ve logged in to your Tools.Valarm.net account, you’ll simply click any of your IoT devices in your Device Manager to arrive at your Device Details Page. Then click the Quick Stats button on your device details page to access this overview list of statistics.
Make sure that you’ve set up custom column names / aliases for your sensor fields. Here’s a tutorial if you haven’t done that already. Select your custom column layout and then click Quick Stats to see statistics for each of your sensor fields / channels:
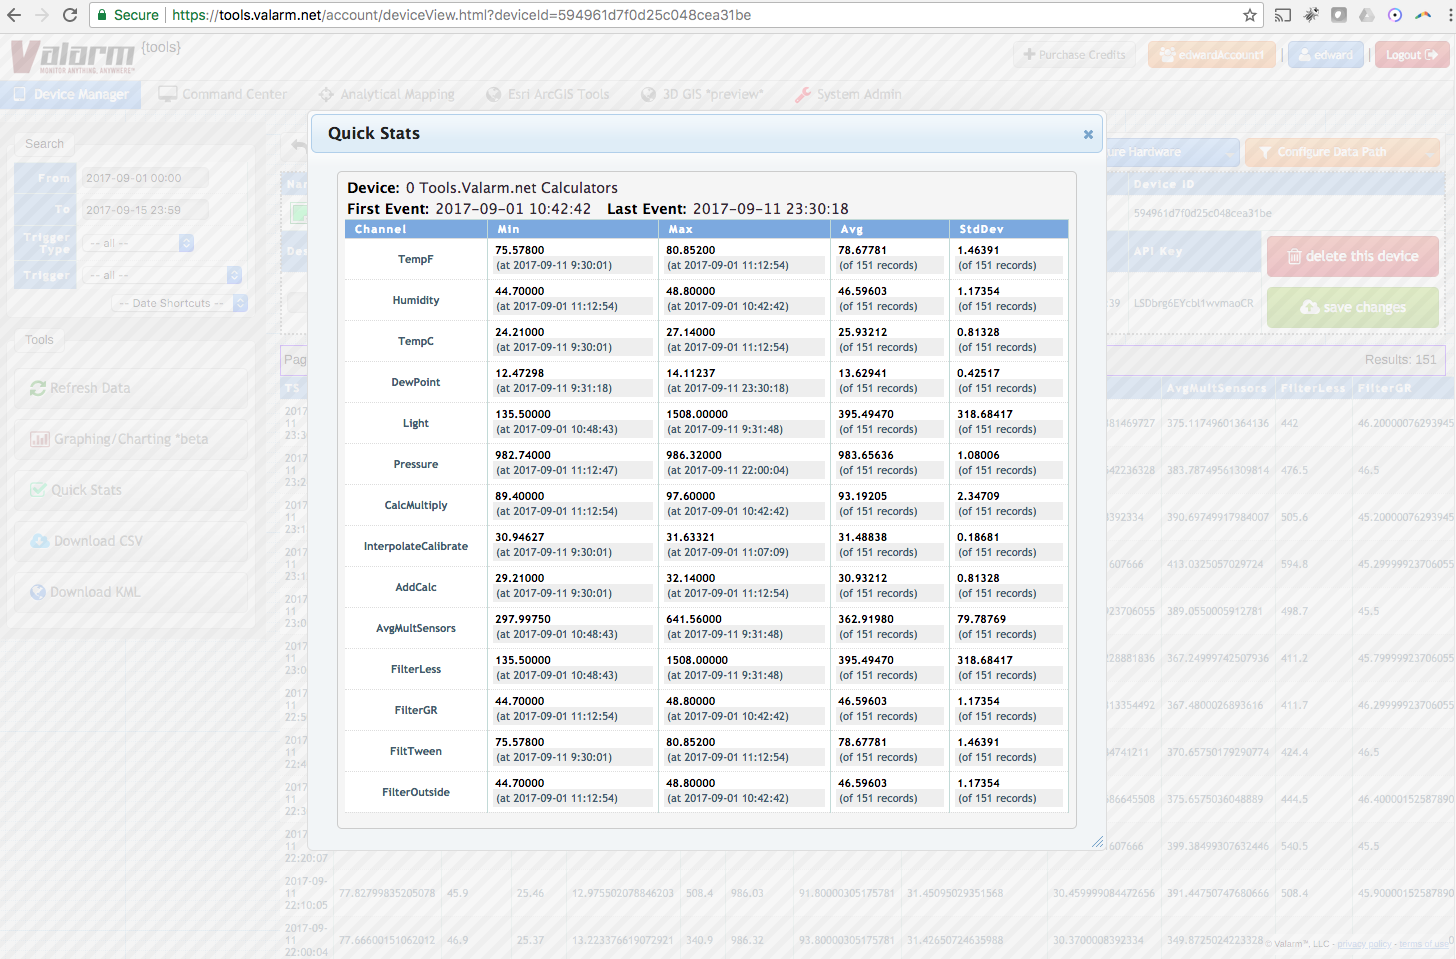
That’s it! Quick and easy. Have a gander at the screenshots to see an example of your new IoT analytics software feature.
We hope that helps you get a quick handle on your sensor data and provides you with valuable information in the simple click of a button.
We’re here to help your organization effectively monitor anything, anywhere. So please don’t hesitate to get in touch at Info@Valarm.net if you’ve got any requests for another software feature, comments, suggestions, or questions!