Does Your Organization Need Remote Environmental Monitoring?
How does Industrial IoT remotely monitor Your air, water, assets, and/or equipment?
Watch the video above to see a breakdown of Industrial IoT Sensor Dashboards for Remote Environmental Monitoring!
Please don’t hesitate to Contact Us at Info@Valarm.net if you’ve got any questions!
Video Voiceover / Transcript:
Howdy! This is Edward from Valarm.
In this video you’ll see how our customers use Industrial Internet of Things, a.k.a., IoT, sensors to remotely monitor water, air, tanks, equipment, assets, and anything that’s important for your organization.
Valarm dashboards use the Tools.Valarm.net APIs to show real-time sensor information on custom web dashboards. We made each of these dashboards according to our customer’s specific needs and continue to improve them as the customer requests.
Please don’t hesitate to contact us at Info@Valarm.net and we’ll help you with your remote monitoring needs.
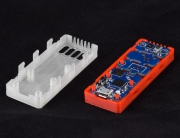
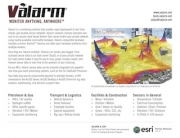
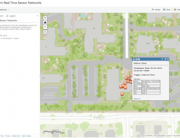
 Let’s take a gander at dashboards for remote environmental monitoring. Once you log in you see an Esri map with all of the environmental monitoring units being monitored. You can see what the remote monitoring boxes look like in the photo. In this case, the units have dataloggers and sensors made by Campbell Scientific and Vaisala for monitoring a variety of air, climate, and weather conditions. For example, there are sensors for temperature, humidity, rain / precipitation, solar radiation, barometric pressure, and fire fuel moisture risk since these units are in a high wild fire risk zone in California.
These units use GSM mobile cell networks and solar panel power to send sensor information to Tools.Valarm.net. Since Tools.Valarm.net is an open platform, you can use sensors made by any manufacturer around the world.
This customer also needed a custom feature to map the fire sensor highs over a certain time period, like 24 hour or 5 day highs. This is critical since everything may look fine and dandy right now, but you’d like to know if there was some risk last week so you know if you need to keep an eye on your remote equipment and assets.
Clicking any of the remote environmental monitoring units shows you the latest sensor readings at that location. You can add any custom calculations, sections, and widgets you need for your remote monitoring applications. At the top of each station page, this customer needed a custom fire condition calculation based off of a combination of sensor readings. This tells you whether it’s safe or hazardous to enter the area.
You see widgets and graphics for the latest sensor measurements like temperature, humidity, rain, precipitation, and fire fuel moisture. You can customize these as you see fit.
In this example there is also a graph for daily precipitation where inches of rain are reported for each day. You can choose the date range you want to graph, whether it’s the last week or month. Mouse over any of graphics to get the exact values.
You can graph any of the sensor values on a timeline, like temperature and humidity as you’re seeing here in the red and blue lines. Mouse over any point on the line, like lows and highs, to see the exact sensor measurement.
The dropdown menu lets you select what sensor values you want to visualize like fuel moisture, system battery voltage, wind speed, or solar radiation. Graphing the solar radiation we can quickly see there were some really cloudy days at this location in the last few weeks, which hopefully lowers your fire risk and keeps you safe.
That’s a quick overview of a Valarm dashboard. Is your organization ready for 1 of these?
 You can use sensors made by any hardware manufacturer like Flowline, McCrometer, In-Situ and Senix.
Whether you need to remotely monitor:
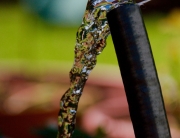
- Air Quality / Pollution
- Water
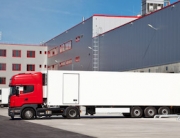
- Industrial Fleet Vehicles, Trucks, or Trailers
- Industrial equipment & Assets
- Anything Else
We’re here to help your organization deploy your most effective remote monitoring system solutions. And thank you for watching!
Please don’t hesitate to Contact Us at Info@Valarm.net.