You’re monitoring a bunch of Industrial IoT sensors and you need to automatically average your measurements for alerting and web dashboards. How do you do it? You’ll learn in these here step by step tutorial guide.
Here’s an example application: with various remote monitoring units deployed in an area you’ve got multiple readings for air quality, water, temperature, or any other sensors you’re monitoring.
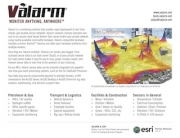
Would it be helpful for you, your teams, clients, or organization to know what the average temperature, flood water levels, or air quality, e.g., ozone, nitrous oxides, or particulate pollution levels are?
Calculators on Tools.Valarm.net let you automatically run statistics like averaging on your Industrial IoT sensor measurements.
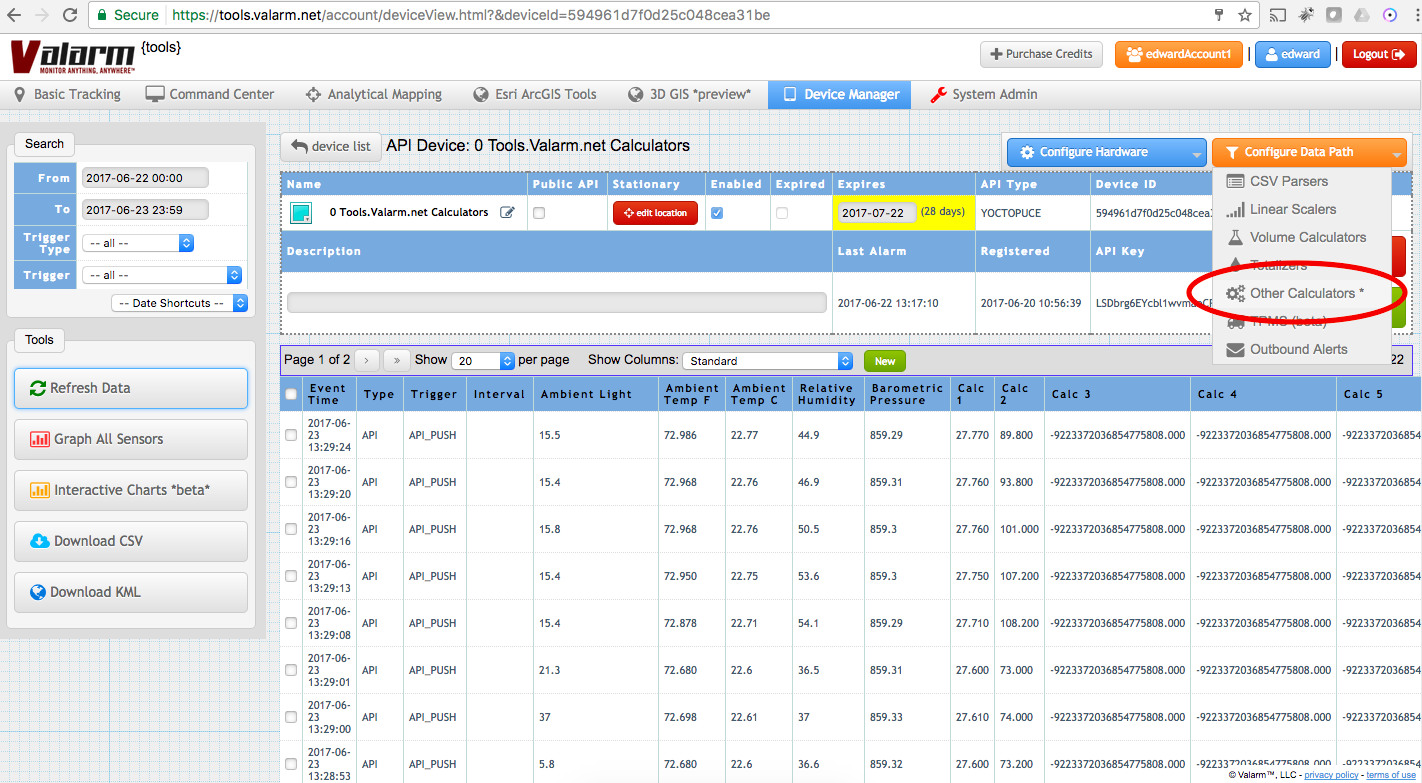
To get started you’ll log in to your Tools.Valarm.net account and select your device you want to configure in your Device Manager.

Then under the orange Configure Data Path dropdown menu you’ll see the Calculators option. Click it and we’re ready to get going.
In the Configure Calculators window, select the basic calculator that gives you the power to automatically average multiple input sensor channels.
Give your new calculator a memorable name and then click the blue + button to create your new calculator.

Next up you’ll configure your calculator. You can average up to 5 different IoT sensor input channels.
There is a Notes field / text box where you’ll type in what you’re doing with this calculator, why you’re doing it, and any other information you, your teams, and others in your organization need to remember.
Choose your output channel, which is the output sensor field / column where you want to store your sensor averaging results.

Select which sensor input channels you’d like to use for your calculations. You can pick up to 5 sensor readings to average and output in real-time.
You’ll notice that in the example screenshot we’re averaging ambient temperature, relative humidity, barometric pressure, and ambient light / lux lumens levels.
Save your newly made Calculator. You’re all done!
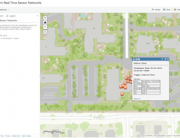
 You’ll see your new statistical calculator is outputting results to the sensor field you’ve chosen.
In the example screenshots you see that the Calculated 3 field has the average of the values from the sensors measuring temperature, pressure, humidity, and light.
Your calculated sensor results are available all throughout Tools.Valarm.net, including:

You can set up multiple calculators to do all sorts of fun activities with your remote monitoring and Industrial IoT sensor information, like:
- Calibrating and Interpolating IoT sensor measurements with algorithms for linear scaling, cubic & Akima splines
- Adding a constant value to all of your sensor reports
You’ve got enormous options with cloud tools that remotely monitor Industrial IoT sensors!
Take a gander at our Industrial IoT Case Studies, Customer Stories, Applications, and Use Cases to see how various Tools.Valarm.net software features are used by governments, organizations, smart cities, and businesses in a variety of industries.
Questions?
 We’re here to help you, your teams, and your organization deploy your most effective remote monitoring systems.
Whether you need to monitor flood warning systems, air quality, tanks of chemicals or any product, water resources, bridges, or anything else, we’ll work with you and help you get it done.
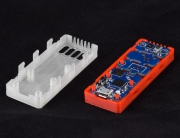
Tools.Valarm.net is an open platform so you can integrate sensors made by any hardware maker, like Flowline, Alphasense, McCrometer, Senix, and any other sensor manufacturers.
Please don’t hesitate to get in touch with us at Info@Valarm.net and tell us about what your organization needs to monitor.