How do you bring your Valarm sensor data into the Esri ArcGIS platform?
The easiest way is to use Tools.Valarm.net JSON API with the Esri GeoEvent Extension for ArcGIS Server.
Haga un clic por aquí para ver este tutorial en español castellano.

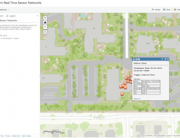
In this HowTo tutorial you’ll learn how to get real-time, geo-enabled remote monitoring data from tools.valarm.net into the Esri GeoEvent Extension so you’ll have it in your Esri GIS for big data analysis, warehousing, and decision-support roles. This is done in the screenshot on where you see water monitoring system info and pH levels from this sensors deployed in remote Pennsylvania streams.

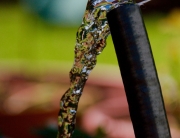
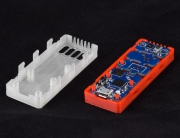
The source of sensor data for this tutorial! Visit shop.valarm.net to get your Valarm compatible sensors and connector device hardware. Here’s a photo of the Valarm deployment that sends water quality sensor data to Valarm Tools Cloud. Valarm telemetry units are used for Industrial IoT and can be powered via solar or any other power source. The sensor boxes connect to the internet via whichever way is best for you, e.g., WiFi, ethernet, satellite, or cell network. In this write-up you’ll see how to use Valarm Tools Cloud’s JSON API to bring this real-time telemetry data into the GIS world using the Esri GeoEvent Extension for ArcGIS Server.

Valarm Tools Cloud graph from tools.valarm.net with pH water quality sensor data from a remote stream in Pennsylvania. How can you get this into the ArcGIS Platform? Use the Esri GeoEvent Extension for ArcGIS Server as shown in this step-by-step tutorial!

On tools.valarm.net copying the JSON API URL for the sensors that’ll get pasted into the Input Connector for Esri GeoEvent Extension for ArcGIS Server.
First off make sure you’ve got these things set up:
- Valarm Tools Cloud JSON API URL for your Valarm sensor data flowing to tools.valarm.net (See the screenshot above and here’s a tutorial on connecting your sensor devices to Valarm Tools Cloud. Also, this page has all the info you’ll need on Valarm’s sensor APIs)
- Installed and configured Esri ArcGIS Server
- Installed and configured Esri GeoEvent Extension for ArcGIS Server
Once you’ve got those things then connect to your Esri GeoEvent Extension Manager in your web browser and follow the steps below!
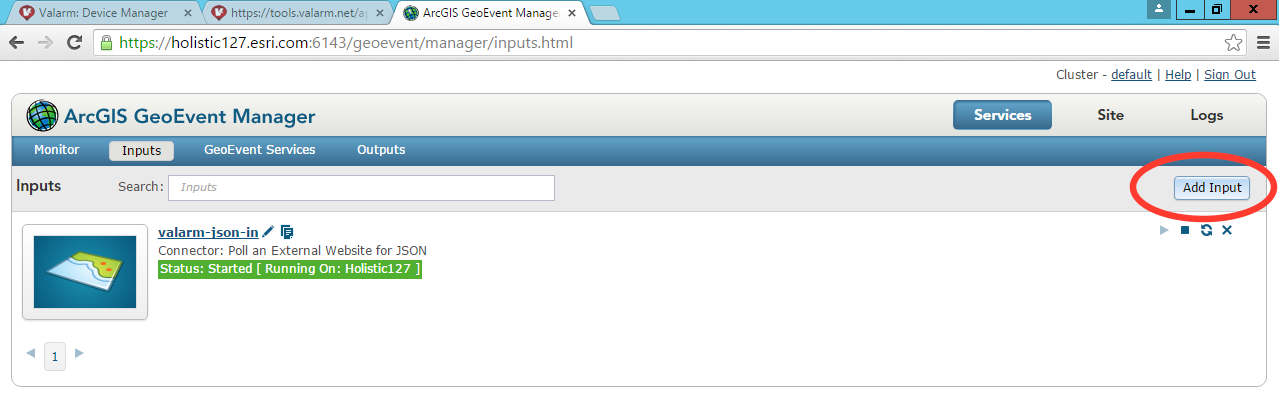
Step 1 – In your ArcGIS GeoEvent Manager go to Inputs and Add Input

Choose Poll an External Website for JSON as your Esri ArcGIS GeoEvent Input Connector.

Configure the JSON Input Connector by giving it a name and pasting in your Valarm JSON API URL. Create a GeoEvent Definition and also be sure to set the x and y geometry fields as well as the JSON Object Name events.
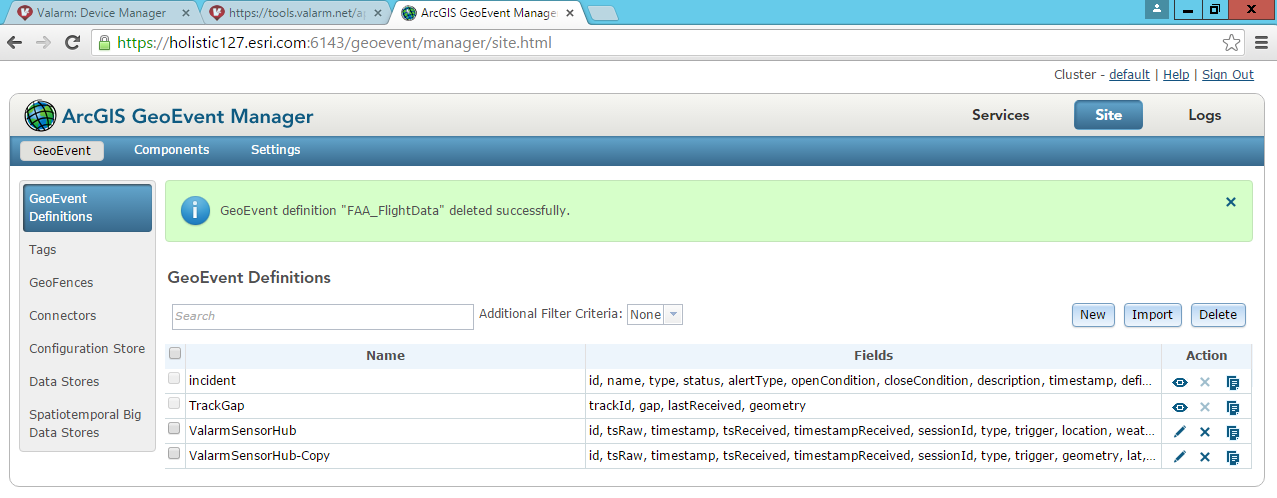
Since the sensor data from the Valarm JSON API comes in a nested format with child components we’ll need to flatten the attributes to properly get your data into the Esri ArcGIS Platform. Go to your GeoEvent Definitions and make a copy of GeoEvent definition for Valarm sensor data. You’ll see more on this in the next steps.

Your original Valarm sensor data has a GeoEvent Definition similar to this. You’ll notice the child elements like latitude, longitude, and altitude under the location parent or the 4-20mA raw sensor channel values under the 4-20mA group.

You’ll need to create a flat GeoEvent definition for your Valarm sensor data and we’ll use Esri Field Mapper to map the sensor factors that you need for your final GIS output. Note here in the final output GeoEvent there are no child elements and it’s completely flat. We’ve also created a new field and called it pH which is where we’ll store the remote water quality sensor data for visualization and analysis with ArcGIS.

Next configure your ArcGIS GeoEvent Output Connector. In this case we’ll Add a Feature to an ArcGIS Spatiotemporal Big Data Store NoSQL Database.

Configure your ArcGIS GeoEvent Output by filling out the fields like giving it a name and your ArcGIS Server Connection.

Now let’s create a Service for the Valarm sensor data under GeoEvent Services. Then we can configure the whole chain of inputs, field mapping, and outputs.

Heads up that this next step’s the kicker – you’ll configure your inputs and outputs by dragging and dropping them onto your new Valarm Esri GeoEvent Service. Add a Field Mapper under the Processor elements on the left. Configure the Field Mapper to map the appropriate fields from the non-flattened, hierarchical Valarm JSON API data to the flattened GeoEvent definition you made. Note that in this case you’ll see we’re mapping channel 1 of the 4-20mA sensor readings in the Source to a field called pH in the GIS database target.

Now you’re all configured and can go to the Monitor page on your ArcGIS GeoEvent Manager. Here’s you’ll see your Valarm data flowing into your input, through your GeoEvent Service, and out to your GIS output. Now let’s see the Valarm sensor data in the ArcGIS platform in Portal, on a map, and ArcGIS Online!
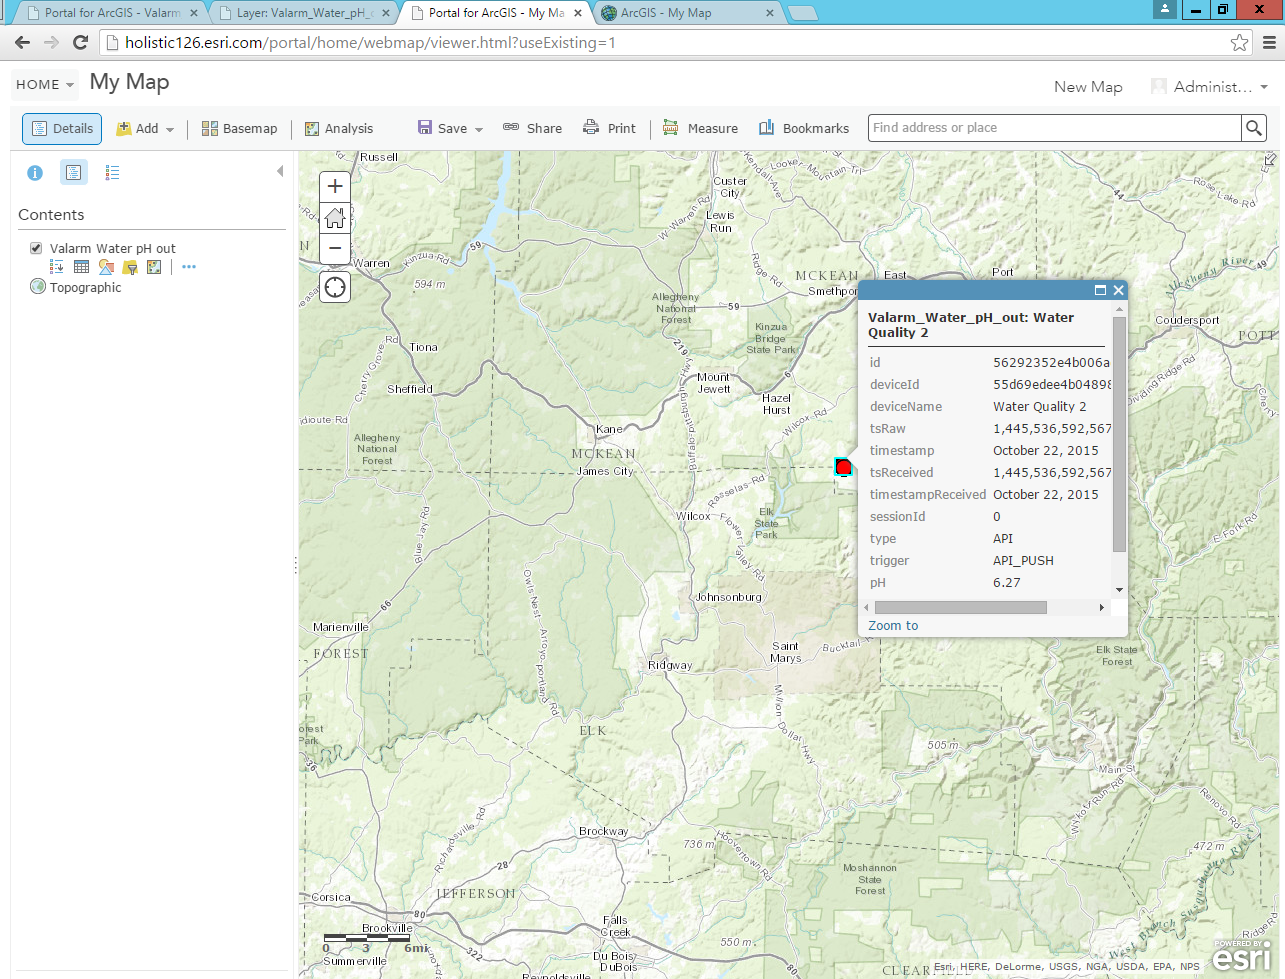
Navigate to your new Valarm sensor data layer in ArcGIS Server and add it to ArcGIS Online or Portal. Here’s an example webmap where we’ve added the pH water quality data to a new GIS Portal map.

Configure your GIS data, map and geovisualize to your heart’s content! Here we’re using the size of the circle icon to show the pH levels of the water in remote streams monitored by Valarm telemetry units.
Now you’ve seen how easy it is to bring your real-time, geo-enabled Valarm sensor data into the Esri ArcGIS Platform by using GeoEvent Extension!
Many thanks go to Jacob Boyle, Adam Mollenkopf, and RJ Sunderman for their help in configuring the demo shown here.
Click here to learn more about the stream water quality monitoring units that were used in this example.
You can literally monitor anything, anywhere with Valarm – have a look at the Customer Stories page for more information on remote telemetry deployments with Industrial Internet of Things / IoT.
For example, see our air quality monitoring systems for effective fluid & water resources management.
Click here to see read this blog post on real-time Valarm sensors with Esri GeoEvent Extension for ArcGIS Server in Spanish.
Please don’t hesitate to contact us at Info@Valarm.net if you’ve got any questions, comments, or suggestions!