Ever need to replace a sensor measurement when a report goes out of range? Perhaps 1 of your 4-20mA Industrial IoT sensors is reporting a value above 20mA and you know that you should just replace that sensor report with a previously reported sensor measurement from recent history, like 19.
Your update to Tools.Valarm.net adds additional features to your calculator for filtering IoT sensor measurements outside of your custom value ranges.
Now if a sensor hub reports a sensor reading outside of your desired range, then you can replace it with a historical, last known “good”value that falls within your range.
A true or false, 1 or 0, boolean value can also be saved to a sensor column or field of your choice.
You’ll see how this works by trying it out for yourself on Tools.Valarm.net. In the rest of this blog story, we’ll go through how to use your new IoT software feature so you can easily follow along.

1st off log in to your Tools.Valarm.net account. In your Device Manager, click your device you’d like to configure with the new out of range calculator features.
Under the orange Configure Data Path drop down menu, click Calculators to see the Configure New Calculators window.
Select the outside of range calculator from the drop down list and give your calculator a name. Click the new, blue plus (+) button to create your new calculator.

You’ll see an Edit Calculator window similar to the one in the screenshot in this blog post. This is where you’ll enable your calculator, configure Input and Output channels, and set calculation variables like min, max, and substitution values for your Industrial IoT sensor devices.
At the top you’ll give your outside filtering calculator a name and some notes to remember why you made this calculator.
In this example we’re making an IoT calculator to filter sensor measurements that are less than 40 or greater than 70. We’re using a sensor hub connected to a relative humidity sensor as in the incoming sensor data input.
 Now the key new software feature here is that we describe in the notes you see in the screenshot – if a sensor measurement goes outside of our range of 40 to 70, then substitute the last known good value from the historical log that was within our desired range. So if a sensor hub reports a value of 68, and then 15 minutes later reports 75 we can automatically save our last known “good” value, 68, in a separate column.
 This may help when a sensor “flatlines” with some temporary max value, e.g., 20mA, and you’d rather replace that sensor value with something useful, the previously known good report. This calculator function will also create a flat line in the graph when values can go out of range and the calculator output stays the same, making a flat line. This calculator is especially useful in scenarios where you know that when a sensor reports outside of your desired range that it is in an anomaly, and it’s most appropriate to replace that value with the most recent historical value that makes sense.
 Next up set your output channels. Output Channel 1 is where to write the calculator value, either the most current sensor measurement if it falls within range, or else, if the most current sensor measurements falls outside of your range, then the calculator will put this in the column – the most recent, historical sensor measurement that falls within your range.
 Output Channel 2 is a flag, 1 or 0, true or false, that indicates whether or not this filter calculator was triggered.
Your Input Channel 1 is the sensor field you’d like to use in your comparisons for your filter range. It’s the source of your incoming sensor data, whether it’s a 4-20mA sensor standard value from an early warning flood monitoring system, a 0-10V sensor, flow rate, temperature, water levels, or anything else.
 Calculation Variable 1 is the minimum value against which the incoming data will be checked and compared. Any sensor measurement that is less than this will trigger your outputs.
The maximum value used for checking and comparing incoming data is the number you enter into Calculation Variable 2. Any sensor measurement that’s bigger than what you set here, will trigger your outputs.
 If you’d like to always substitute a specific value when a sensor report is out of range, you can set that in Calculation Variable 3. If you leave this blank, then the last known “good”value within your desired range will be saved into your Output Channel 1 field / column.
Calculation Variable 4 is the optional flat-line mode, which sets how far back in the sensor event log you’d like to seek a previous ‘valid’ value for substitution, if the incoming sensor data falls outside of your defined range. The maximum events to check is 20. You may leave this field blank or as 0 if you’d like to disable historical substitution. If a valid value is not found or used before reaching this maximum, the value (if any) defined in Variable 3, will be used.
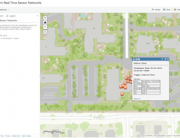
 You can see in the screenshots included in this blog post some examples of how this calculator works and the results in graphs and 2D and 3D maps.
That’s your basic overview of this new Tools.Valarm.net feature.
If you’ve got any questions then please don’t hesitate to get in touch with us at Info@Valarm.net