In this blog post you’ll learn about more ways you can customize your Tools.Valarm.net Industrial IoT sensor dashboards.
You can customize your IoT device pages and gauge panel homepages with your own custom configurations depending on your water flow meters or other sensors you’re monitoring like flood warning systems.
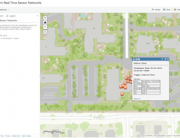
Here’s an example below with a Valarm dashboard overview map and gauge homepage monitoring water flow meters.


We’ll drill down on the IoT device CHPP2 to see further details of the flow meter measurements.
Here below you see a gauge that maxes out at 50, and reports in “Liters/Second” – neither is quite appropriate for this sensor monitoring water levels / water pump / flowmeter.

You can change that in the Device settings on your Valarm dashboard. We’ll change “Liters/Second” to be “L/s” and a few other things.

We’ll change the deviceReportRateInMinutes from 10 to 1. This means that the flow meter data from this IoT sensor device will automatically refresh every 60 seconds / 1 minute.
We’ll also change the gaugeUnitsFlowRateMax to 200. So now our typical flow meter readings around 180 liters per minute will be better visible on the flow rate gauge.

Since we changed the “deviceReportRateInMinutes” and “gaugeUnitsFlowRateMax”, we’ll refresh our Valarm dashboard to see the updates. Now the drilldown page with this IoT device details looks like this below.

Note that our flow meter gauge is no longer redlining maxed-out with a flow rate of 180 liters per second, since we set our gauge’s new max flow rate to 200 L/s. And the page automatically refreshes with the latest IoT sensor measurements every minute / 60 seconds.
That’s your quick overview of some additional customizations you can do with your Valarm dashboards and Tools.Valarm.net.
Send me a message at Info@Valarm.net if you’ve got any questions.