 What’s the most cost-effective way to upload your remote sensor measurements to Tools.Valarm.net from your rugged Campbell Scientific and Vaisala sensors?
Do you need to be alerted when IoT sensor readings go above, below, inside, or outside of your custom threshold?
Does your organization need a customized, real-time web dashboard viewable on any device with a web browser, like phones and tablets?
This story focuses on a Valarm customer (an environmental consulting agency) that uses Campbell Scientific Data Loggers connected to Vaisala and Campbell Scientific sensors for real-time telemetry of:
- Wild Fire Risk (using a fire fuel moisture stick)
- Rainfall + Precipitation
- Wind Speed
 Wind Direction
- Humidity
- Temperature
- Barometric Pressure
- Solar Radiation
In additional to the sensors listed above, you can easily integrate Tools.Valarm.net with IoT sensors made by any hardware manufacturer.
We’re here to help you rapidly deploy affordable Industrial IoT systems to solve your remote monitoring challenges.
In the photos you can see the guts, details, and looks from 1 of the Valarm units that’s deployed in the field. The systems are solar powered and automatically upload the latest sensor information every 15 minutes to Tools.Valarm.net, then our JSON APIs forward the sensor data to a web dashboard.
Note: Are you a video visual learner? Watch this video tutorial to learn how your organization can use Valarm + Campbell Scientific solutions for your remote monitoring needs.
The photos also show the solar panel and all of the sensors deployed in this Valarm unit like wind speed, wind direction, solar radiation, rainfall / precipitation, and weather. We highly recommend the Campbell Scientific and Vaisala brand sensors since they’re super reliable and rugged. They know how to make excellent hardware, and our customers love using Campbell Scientific and Vaisala hardware with our flexible, cost-effective Valarm Tools Cloud software.
 On the right you’ll see the wild fire risk / fire fuel moisture stick used in these Valarm deployments. It’s a pretty cool sensor made by Campbell Scientific called the CS506-L. See below for tips on this fire risk sensor and other Lessons Learned from this Valarm deployment.
Inside the weatherproof boxes in California, each set of sensors connect to Campbell Scientific CR1000 dataloggers. Each CR1000 connects to an RS-232 sensor adapter from shop.valarm.net.
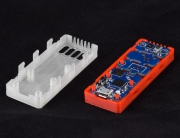
Each RS-232 sensor adapter is plugged into a 3G GSM sensor hub that connects to Valarm Tools Cloud via AT&T‘s mobile cell network.
Industrial IoT sensor hubs automatically upload your sensor data at your desired time interval, as often as you need it.
Once the sensor information is available at Tools.Valarm.net, you can map, graph, and analyze your data using our SaaS IoT portal and cloud tools database. You can also use our APIs like JSON to forward your Industrial IoT sensor information in real-time to your business intelligence / analytics systems and executive dashboards. Specifically, in this case the units you see in the field are sending their sensor data to a custom, web-based IoT dashboard developed by Valarm.

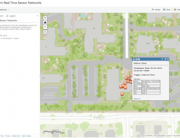
 The home landing page for this Valarm dashboard features Esri maps that quickly lets the customer know the current wild fire risk for each zone where there is a Valarm monitoring unit. Each area is colored according to the extremity of fire risk:
- Low Wild Fire Risk = Green
- Moderate Fire Danger = Yellow
- High Risk of Wildfire = Orange
- Extreme Fire Danger = Red
With Valarm’s web dashboards you can graph historical data for any combination of sensors values. Using any device with a web browser, like your phone or tablet, you can view the dashboard webpages with maps and widgets like you see in the screenshots in this story.
You can also put your custom logo on your dashboards and we’ll manage the cloud setup, installation, and maintenance! Valarm is a flexible platform so you can make your own dashboards if you’ve got the coding resources, or if you’d like to save your time and your money then simply contact us at Info@Valarm.net and we’ll help you with just what you need!
Here are examples of other dashboard webpages we’ve made for customers that need to monitor:
- Water Well Levels / Depths with Pressure Transducers + Water Usage with Flow Meters
- Tank Volumes + Levels for Chemical Resources Distribution, Management, and Supplier Managed Inventory
Also have a look at our Industrial IoT Customer Stories Page where you’ll see how Valarm is used around the world in industries like high tech transport, oil & gas, agriculture, mining, governments, petroleum, hydraulics, bridges, flow meters, cities, fleet vehicle tracking, environmental consultancies, water telemetry, air quality monitoring, and flood monitoring systems for early warning alerts.
Note: Are you a video visual learner? Watch this video tutorial to learn how your organization can use Valarm + Campbell Scientific solutions for your remote monitoring needs.
Lessons Learned:
- Some of these fire and weather monitoring deployments are way out there in the wilderness. Way out there like you have to travel on horseback and bring a burro to carry your supplies and sensors. Then camp out for a night, finish deploying the box and come back the next day on your horse! So it’s critical to make sure you’ve got everything you need with you when you head out. You don’t want to have to come back for that 1 special favorite tool. By first deploying the units closest to accessible roads you can refine exactly what you need for each deployment. This’ll help to make sure that you don’t forget anything when you deploy the truly remote monitoring units!
- Don’t touch the fire fuel moisture stick! It looks impressive but don’t touch it since the oils and other stuff on your fingers will mess up the calibration and future sensor readings.
- Automatically send your battery voltage values to Tools.Valarm.net along with all of your other sensor data. This lets you confirm that your battery is being topped up each day by the sun, and hopefully staying at a healthy 13+ Volts. If it’s not, and your voltage is getting low in the wee hours of the morning, then you probably need a bigger solar panel! 🙂
Do you or your organization need Industrial IoT / sensor telemetry solutions? We’re happy to help you with rapidly deployable + cost-effective remote monitoring solutions.
Please don’t hesitate to contact us at Info@Valarm.net if you’ve got any questions.
Or, if you prefer to talk to us on the phone then give us a call at +1 (424) 442-0963.


