Would you like your own webpage with real-time dashboard information on your assets that are remotely monitored with Tools.Valarm.net?
Want a simple + easy way to get your sensor telemetry on any mobile device like a phone or tablet?
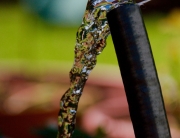
We’ve helped multiple customers do just this with Valarm’s web-based dashboards. This write-up is about a tank farm where a bunch of tanks are being monitored at AG RX in California for their levels and volumes in gallons of different materials, fertilizers, and chemicals.
These tanks vary in type and size, which makes the deployment challenging yet fun. With Tools.Valarm.net and JSON APIs you can get your sensor data into any business intelligence and analysis system or other endpoint of your choice.
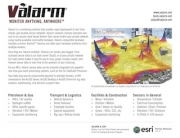
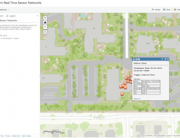
On this page you’re seeing an example of a simple, custom web dashboard for tank asset management.

In the web dashboard screenshots you’re seeing the levels for the tanks in this photo!
Have a look at the stories below for more specific details on how the Valarm devices are using ultrasonic and radar level sensors, along with WiFi or ethernet internet connectivity, to get real-time tank sensor measurements to Tools.Valarm.net:
- Cost-Effective, Solar-Powered Tank Monitoring with WiFi
- Tank Level Monitoring with Pulse Radar Level Sensors
- Remote Tank Telemetry in Real-Time
The stories above have all the details and components you need to do your own remote monitoring with Tools.Valarm.net. All of the tanks have their data displayed in the Valarm dashboard no matter their size, level sensor type (radar vs. ultrasonic), power source (solar vs. regular wall mains 110V), or internet connectivity (ethernet cable vs. Wireless network).
 In these webpage dashboard screenshots you’ll see:
- Tank names
- Current tank volume and historical levels
- What’s in the tank, e.g., phosphate, sulfuric acid, fertilizer, zinc, oil
- Date range dropdown menu to let you select what time period and history you’d like to see
This is a basic, simple example to demonstrate how easy it is to view Valarm monitoring information on a web-based dashboard.
Note that since Tools.Valarm.net is an open, flexible software platform, you can integrate sensors from any manufacturer can be used like 4-20mA levels sensors made by Flowline, Omega, Maxbotix, Senix, Eno Scientific, or APG Sensors.
There are tons more possibilities for adding widgets, gadgets, maps, and additional features.
Since Valarm can literally monitor anything, anywhere, you can imagine visualizing your specific sensor data, whether it’s:
- Water
- Pressure transducers, flow meters, and groundwater well depths + levels
- Wild fire risk, climate, and remote environmental monitoring
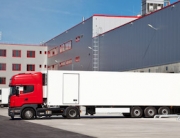
- Fleet vehicles, trucks, and trailers with industrial equipment like vacuums and pumps
- Fluids
- Flood Warning Systems Monitoring Rising Tides, Storm Surges, and Natural Disasters
- Or anything else you’re monitoring or would like to monitor!
See our Customer Stories page for more on what our customers are doing with Tools.Valarm.net monitoring systems.
Also have a look at our Web Dashboards page for more dashboards we’ve made for customers like:
- Water well monitoring – flow meter rates and water depths for effective water resources management
- Fire danger and meteorology sensor telemetry
We’ll make a web-based sensor dashboard that’s configured specifically for you, your teams, and your organization.
Please don’t hesitate to contact us at Info@Valarm.net if you’d like a demo or any help with remote monitoring
[Esta historia está disponible en Español Castellano por aquí]