Does your organization need an effective way to graph and chart your Industrial IoT sensor information?
Quickly gain insights and hotspots on what your remotely monitored assets are up to. Or what they’ve been up to in the past or what they’ll likely be doing in the future!
Up above you’ve got a video tutorial on how to get started with interactive graphing and charting on Tools.Valarm.net.
You’ll see graphs and charts of remote air quality sensor measurements. If you’re not a fan of video or movies, you can see here is the more analog, old-school write-up on this with pictures and screenshots.
Your organization can get additional sensor hubs and sensors at Shop.Valarm.net.
Questions?
Please don’t hesitate to Contact Us at Info@Valarm.net.
We understand remote monitoring and Industrial IoT. We’re happy to help you monitor anything, anywhere.
Video Transcript / Voiceover:
Howdy!
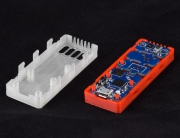
This is Edward from Valarm. In this video you’ll learn about some of the graphing and charting functionality in Tools.Valarm.net, a.k.a., Valarm Tools Cloud. If you don’t already have your Valarm remote monitoring devices set up, then watch our other videos on connecting your Industrial IoT sensors and remote monitoring telemetry devices to Tools.Valarm.net using your IIoT hardware available at Shop.Valarm.net.
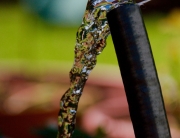
Let’s get rolling on graphing and charting for Industry 4.0 / Industrial IoT. First off you’ll log in to your account at Tools.Valarm.net. We’ll be using graph data from air quality sensors like this Alphasense OPC-N2 you see here. The OPC-N2 is an Optical Particle Counter that measures particulates in the air, like dust, PM1, PM2.5, and PM10. Tools.Valarm.net is an open platform that’s compatible with any sensors from any manufacturers, so we can help you monitor air quality, water, vehicles, fluids, trucks, tanks, trailers and anything else you need to monitor.
Please don’t hesitate to Contact Us at Info@Valarm.net if you’ve got any questions.
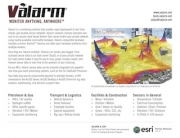
Note that you can also use our 3D Earth Globe maps for your sensor data like you’re seeing here. Let’s talk more about these nifty 2D graphing and charting tools for your Industrial IoT sensors.
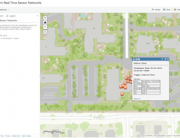
After you’ve logged in to Tools.Valarm.net go to the Device Manager and select the device you want to chart and graph. Pick a set of custom sensor names you’ve set up for your columns. In this example we’ll select the Particulate Matter columns that rename Calc 1, 2, and 3 fields to PM1, PM2.5, and PM10.
Now we’re ready to do interactive charting and graphing.
You can mouse over any point on any of your graphs to see the exact sensor readings / measurement value.
The checkboxes next to the sensor field names turn them on and off in your graph visualizations.
Clicking the name of a sensor field quickly shows just those measurements on the graph.
Here we’ve started with the line graphing option and stacked. You can use the slider to adjust smoothing.
The sliders at the bottom adjust the time window for the sensor information that you want to focus on.
Let’s have a look at the area charts with the stacked option. Try out the different settings for cardinal, linear, and step graphing methods. Combine all this with the smoothing and time zooming you did earlier with the line graphing.
Try out the stacked bar charts.
This shows you quick and easy how the sensor readings compare to each other. In this case green is PM1, blue is PM2.5 and orange is PM10 air quality sensor measurements.
Last up are your scatter plots. And now you’ve seen a few of your graphing and charting options with Tools.Valarm.net so log in and do it with your Industrial IoT sensors and your organization’s remotely monitored assets. Thanks to Shutterstock Rickshaw for the awesome JavaScript toolkit!
Remember that if your sensors are mobile and GPS-tagged you may also see them plotted on 3D earth globes. Click the 3D GIS tab to explore this. And watch our other videos to learn more about this feature and others on Tools.Valarm.net.
Questions?
Please don’t hesitate to Contact Us at Info@Valarm.net if you’ve got any questions. And thank you for watching!