How do you monitor groundwater volume and groundwater availability?
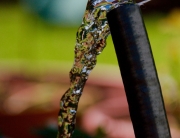
It’s hard to know what’s going on at really remote water wells! Some organizations pay people to drive out to each well 1 time each week, month, or year to collect the data manually.
How can your business save time and money with your water resources management needs? By deploying Valarm water monitoring solutions your organization’s water data is automatically put on a private webpage so you and your teams can view it on any device with a web browser and receive e-mail alerts.
There are many different hardware manufacturers for sensors like pressure transducers and flow meters. This makes it challenging to answer the question – what’s the most effective way for you to monitor your remote water assets?
At Valarm we help our customers monitor water, fluids, and just about anything else, anywhere in the world! Tools.Valarm.net is an open platform so we work with sensors made by hardware manufacturers from around the world.
We also use any power source and whichever internet connectivity options is best for you, e.g., WiFi, ethernet, or GSM cell network.
Once your remote monitoring data is on Tools.Valarm.net, you can use our APIs to pull or push your geo-tagged sensor data to any endpoint like Esri ArcGIS and your other business intelligence / analysis systems.
In this write-up you’re seeing a custom web dashboard we made for 1 of our customers so they can more effectively monitor their water resources and quickly know what’s going on in the field, a.k.a. situational awareness for decision-making with well water level monitoring systems.
A few months back Lorenzo, Pawel, and Edward from Valarm deployed and trained the customer’s staff on how deploy cost-effective telemetry solutions.
 We’ll be covering your water well monitoring systems with web dashboards in this post. You can see more photos and details of the hardware in the field in our blog post on Monitoring Water Usage in California.
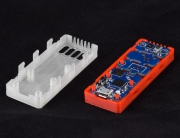
You’ll see how we use Valarm compatible sensor hubs, 4-20mA, and PWM pulse counter sensors along with long range WiFi to send real-time information from water flowmeters and pressure transducers to Tools.Valarm.net.
A key point to note is that this deployment uses hardware from a variety of manufacturers, e.g., the flowmeters are made by McCrometer and the pressure transducers / water well depth sensors are made by In-Situ. This is a distinct advantage of Valarm since we’ll help you to:
- Get the data from any and all of your sensors in the field, since we’re an open platform we’re happy to work with various sensor makers and manufacturers
- Make sure your data isn’t trapped anywhere
- Confirm that all of your Industrial IoT information is always available exactly where you want it
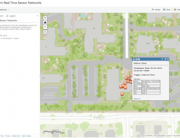
In the screenshot you’ll see the landing page for your Industrial IoT web dashboard. This is simply a webpage so you can see it on any mobile device, like a phone or tablet, as well as your desktop or laptop computer. There’s a map showing the location of each water well with a flag icon.
If you click any of the water wells you’ll see the remote monitoring dashboard with the latest sensor information that Valarm device sent to Tools.Valarm.net.
 Take a gander at this write-up for more info on water monitoring sensors you can deploy in each of your water monitoring systems. Your dashboards includes widgets that visualize these factors:
- Water pump rate from McCrometer flowmeters (gallons per minute)
- Water flowmeter totalizer (in gallons)
- Water above sensors as reported by In-Situ pressure transducers
- Depth to water
- Pump headroom
Further down on the dashboard page for each water well you have historical graphing. Use the calendar to select the historical dates you’d like to view a graph of and then select which factors you want to see in your graph. In the sample on the right you’ll see a temporal graph with:
- Depth to water (ft)
- Pump rate (gpm)
Holding your mouse over any point in the graph shows you precisely what the water well sensors reported at that moment in time.
This water management system provides a quick and easy view of exactly what’s going on with your assets at remote locations so you and your team don’t have to drive out to the field to manually collect the data and then enter it into your systems. Here we’ve got all that already taken care of.
Those are key features showing you just how this water well dashboard webpage works. Have a look at our Remote Monitoring Dashboards page for more Industrial Internet of Things sensor devices with examples like:
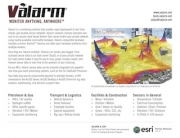
- Remote Environmental Monitoring: Wild Fire Risk + Meteorological, Air, & Weather Sensors
- Tank Levels and Volumes Telemetry: Effective Chemical Distribution
Also see our Customer Stories page for additional case studies of Valarm remote monitoring and sensor solution deployments for monitoring anything for government agencies and organizations in any industry, like:
- Air Quality & Pollution – Gases, VOCs, Ozone / O3, Nitrous Oxides / NO2, SO2, Particulate Matter, PM2.5
- Fleet Vehicles, Trucks, & Trailers Loaded Up with Industrial Equipment like Pumps, Vacuums, and Tanks
- Flood Warning Systems – Remotely Monitoring Water Levels, Rising Tides, Storm Surge, Flooding, and Emergency Preparedness for Natural Disasters in Smart Cities
[Hace un clic por aquí para echar un vistazo a este relato en Español castellano de Valarm Industrial IoT, monitoreo de remoto, sensores y telemetría]
Note that with Tools.Valarm.net you can use sensors made by any manufacturer like Flowline, Senix, APG Sensors, Seametrics, McCrometer, Libelium, Vaisala, Alphasense, Campbell Scientific, Geokon, EKM Metering, Applied Measurements, Dwyer Instruments Manufacturing, B Meters Metering Solutions, Omega, Automation Direct, and any others. Let us know what you need to monitor and we’ll work with you to deploy your most effective remote monitoring solution.
 Would you like dashboards for you, your team, or your clients and customers?
We’ll make 1 of these for you with your logo and all the remote monitoring / telemetry information you need for your business.
Have a look at this video overview of how you can use IoT water sensors for your water well monitoring dashboards.
Questions?
Please don’t hesitate Contact Us at Info@Valarm.net if you’d like a demo or have any questions on your most effective remote monitoring solution for your particular needs.