 You can now visualize your Valarm Industrial IoT sensor information in 3D the next time you log on to Tools.Valarm.net!
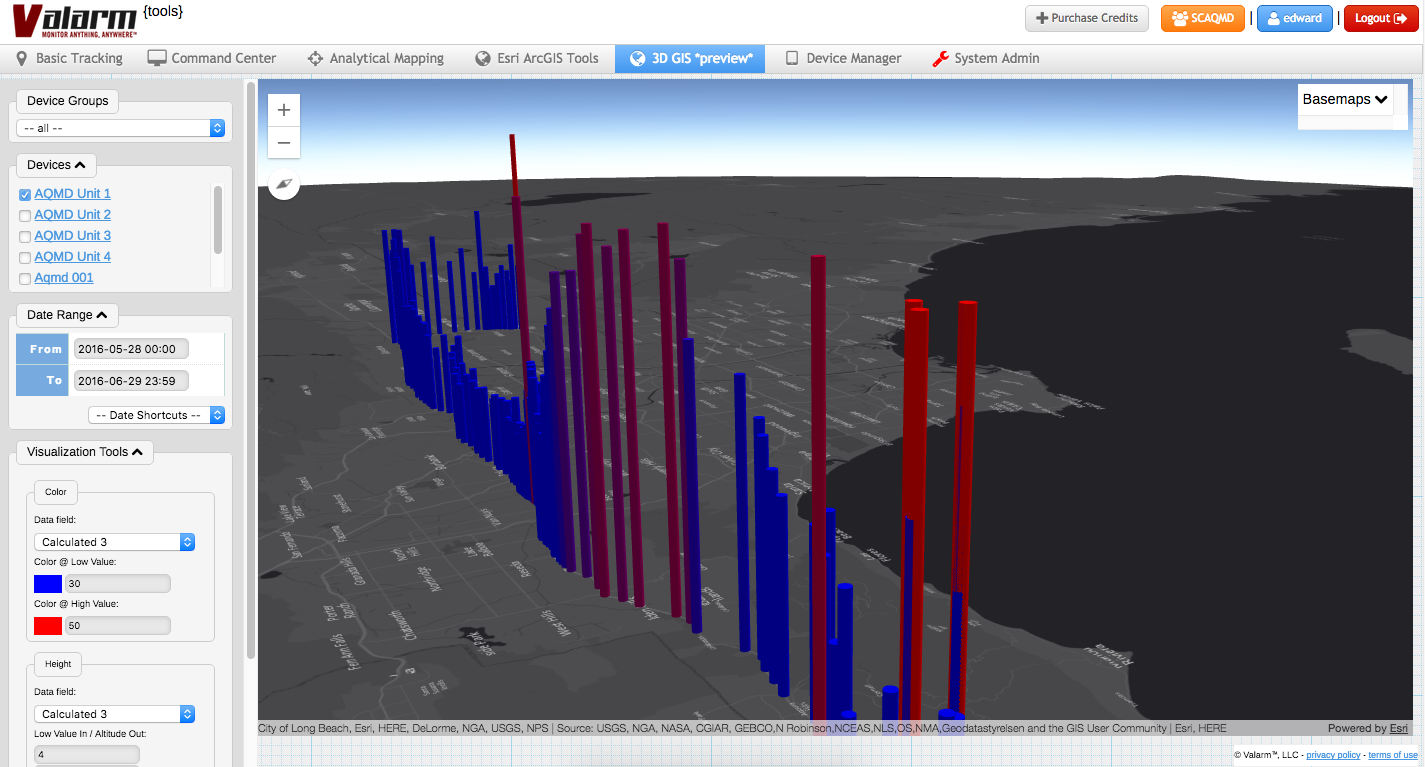
We’ve added a new tab you’ll see along the top of Tools.Valarm.net after you login. Click the 3D GIS tab to see how you can use these 3 dimensional visualization tools.
Update: Check out this video tutorial here of how to use Industrial IoT, remote monitoring, and sensor telemetry with 3D Earth Globe Maps.
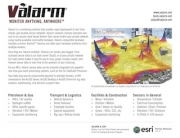
Thanks to the Esri ArcGIS Platform this new feature makes for stunning visualizations like the ones you see here. The sensor data you see visualized in these screenshots are from Valarm air quality monitoring systems made for AQMD, the government entity responsible for monitoring and compliance of air quality in Southern California, Los Angeles, and Orange County.
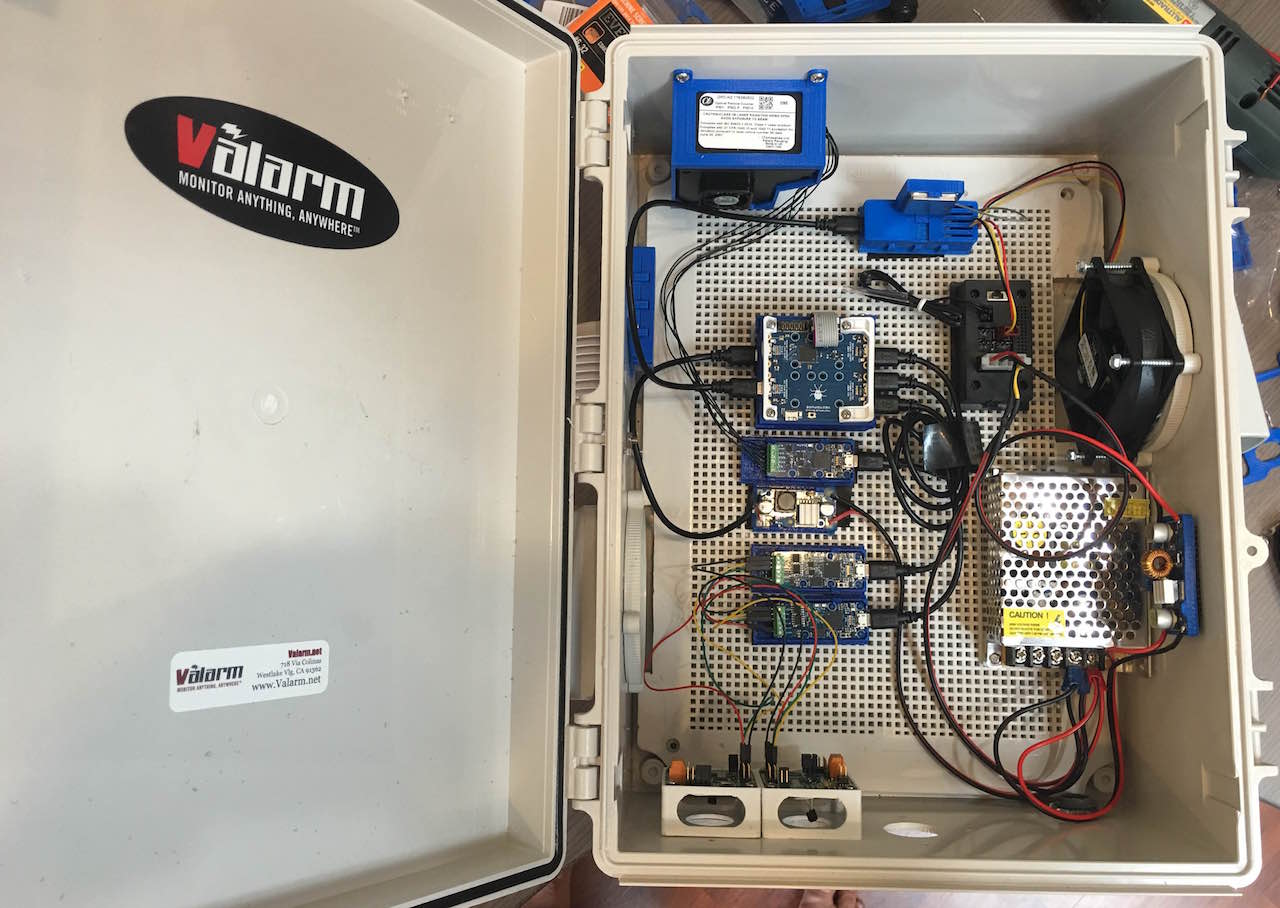
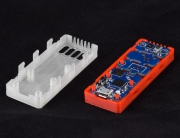
Big thank you goes out to this Valarm air quality monitoring box, which provided the air quality sensor information you see here in the Esri ArcGIS 3D visualizations on Tools.Valarm.net. We can make 1 for you and your organization just like we did this for AQMD, the California government agency for air quality monitoring and compliance.
The 3D sensor visualizations you see here are from Valarm units that monitor:
- Ozone (O3) Sensors made by Alphasense
- Nitrogen Dioxide (NO2) Sensors Made by Alphasense
- Particulate Matter (PM1, PM2.5, PM10) OPC-N2 Particle Counter Sensors Made by Alphasense
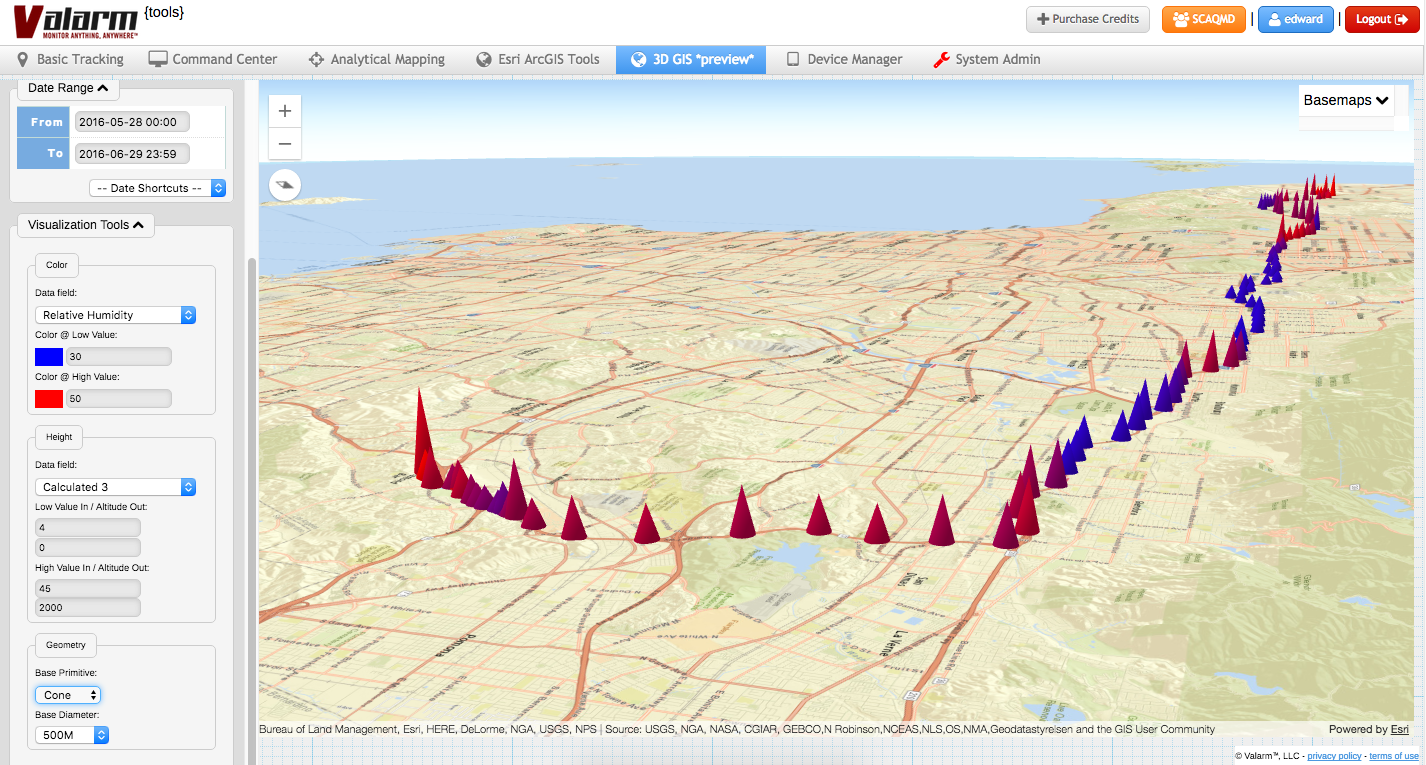
For seeing your sensor information in 3D with Esri ArcGIS you’ll need to pick the sensor data field you want to use for color and the field you want to use for height. With the color visualization you can choose a color to use for the low sensor values and a color to use for the high sensor values. Your features will automatically transition from the low to high colors you’ve selected.
 Pick the low and high sensor values that make sense for your sensor readings. For example, if you’re visualizing info from a 4-20 mA sensor then set your low and high range values to 4 and 20, respectively. You can also change the width / base diameter of your sensor data points. Choose the geometry type that you like most, any of these 3 C’s – Cylinders, Cubes, or Cones!
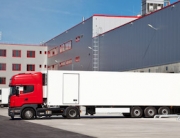
 Check out our Customer Stories page to see what our customers around the world are monitoring, like water, high tech transport vehicles, and air quality.
Valarm is used in a bunch of different industry verticals like natural resources, government agencies, flood monitoring, mining, agriculture, oil & gas, water resources management, chemical distribution, and remote environmental monitoring systems.
You can use sensors made by just about any hardware manufacturer. Here are some favorites used by Tools.Valarm.net customers:
Do you, your teams, and your organization need a custom webpage with your logo on a dashboard with your remote sensor information?
 Take a gander at our web-based dashboards for Industrial IoT, sensor telemetry, and real-time remote monitoring. You can receive email and/or SMS text message alerts whenever any asset or sensor goes above, below, between, inside, or outside of your desired range. All of the Valarm monitoring information is viewable on maps (2D + 3D), graphs, and other widgets by simply using a web browser on any device, like your tablet or phone!
Questions?
Please don’t hesitate to contact us at Info@Valarm.net with any questions about your organization’s remote monitoring needs.