
 Gallery
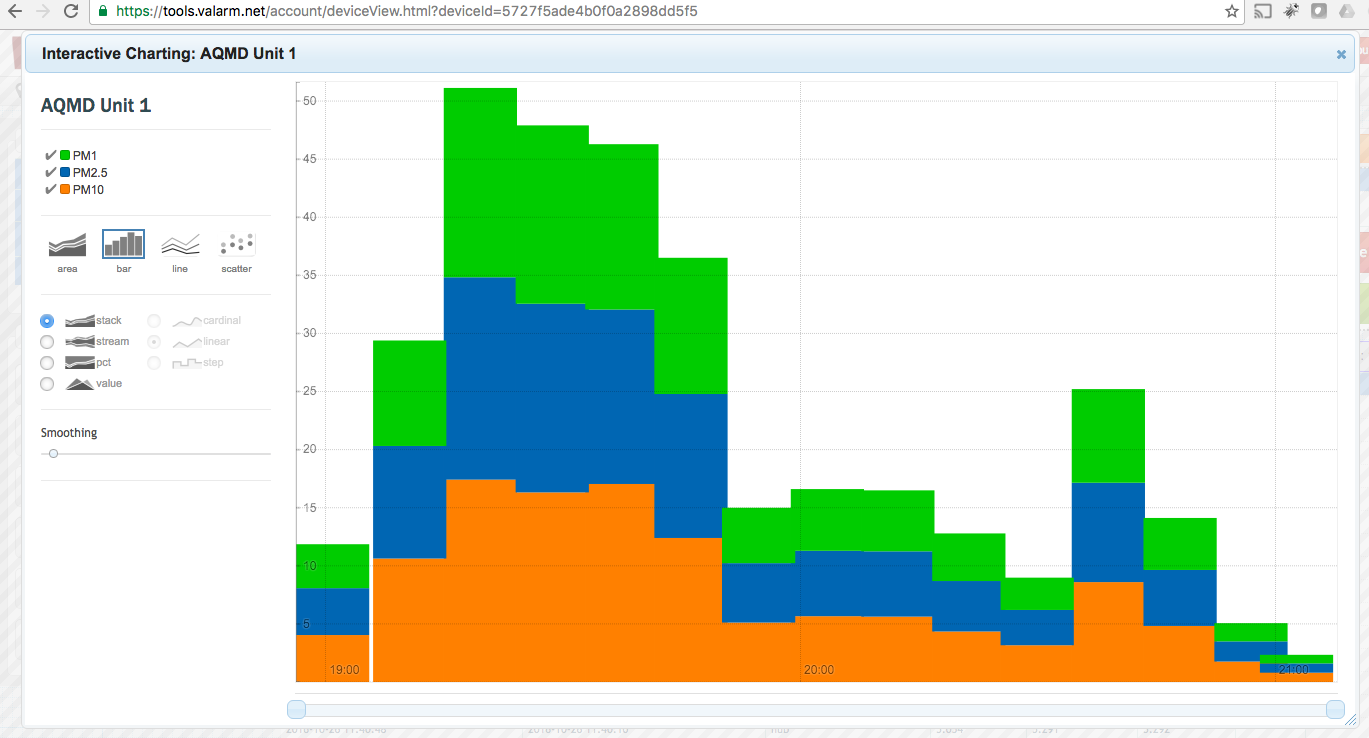

Tools.Valarm.net Does Interactive Charting & Graphing for Remotely Monitoring + Visualizing Your Organization’s Industrial IoT Sensors
Looking for an awesome way to graph, chart, and visualize your organization’s Industrial IoT [...]


Looking for an awesome way to graph, chart, and visualize your organization’s Industrial IoT [...]


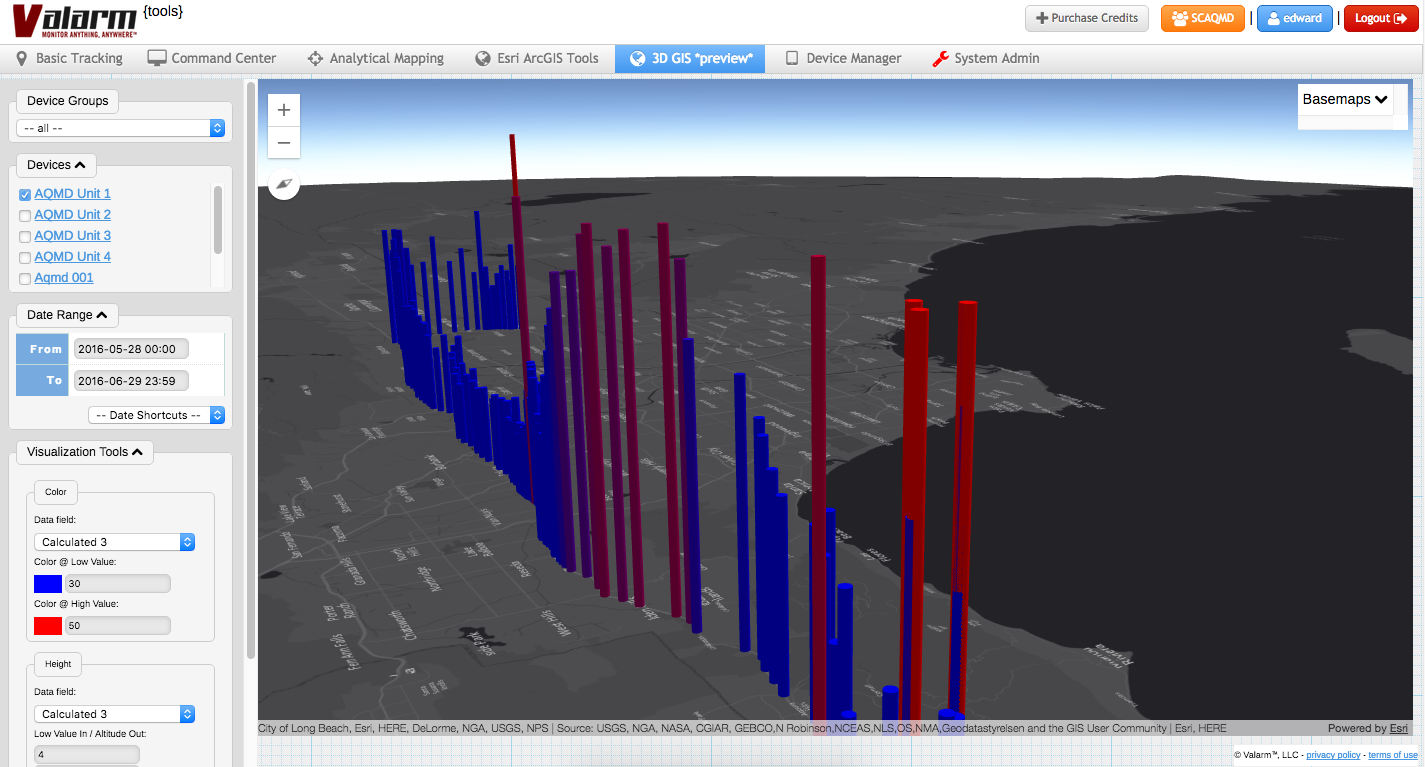
You can now visualize your Valarm Industrial IoT sensor information in 3D the next [...]


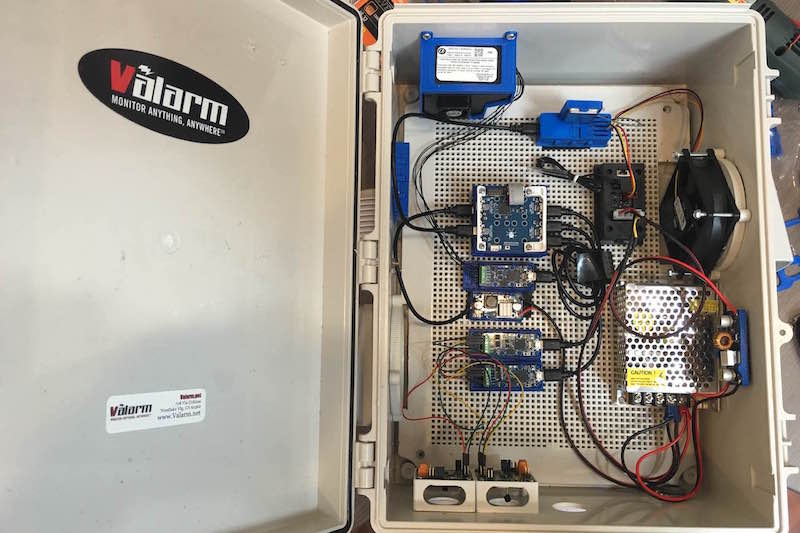
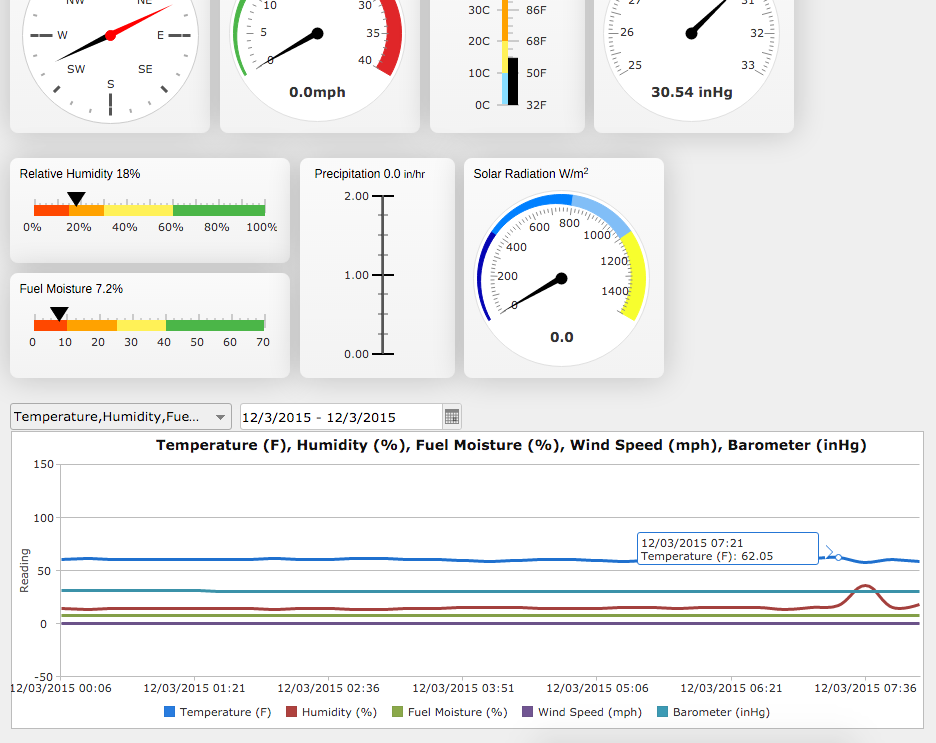
Do you, your teams, or your organization need easy-to-use, web-based dashboards to quickly show [...]
We submitted an entry this spring for the Esri Data Viz App Challenge that [...]
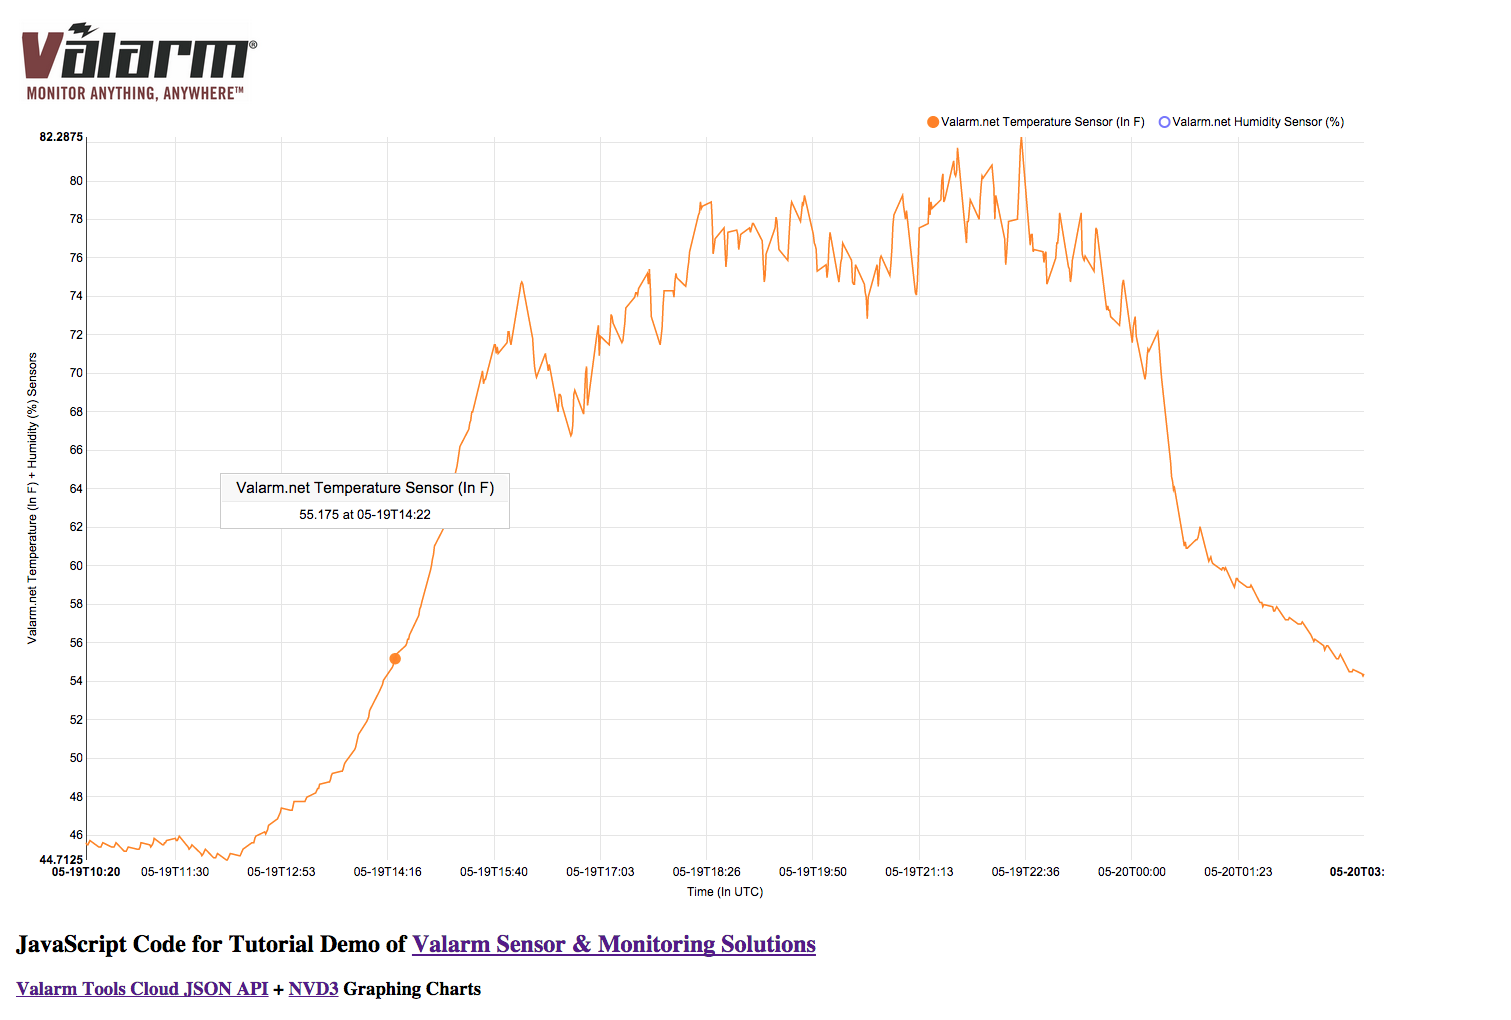
You want an easy way to graph your real-time, remote sensor data on your [...]
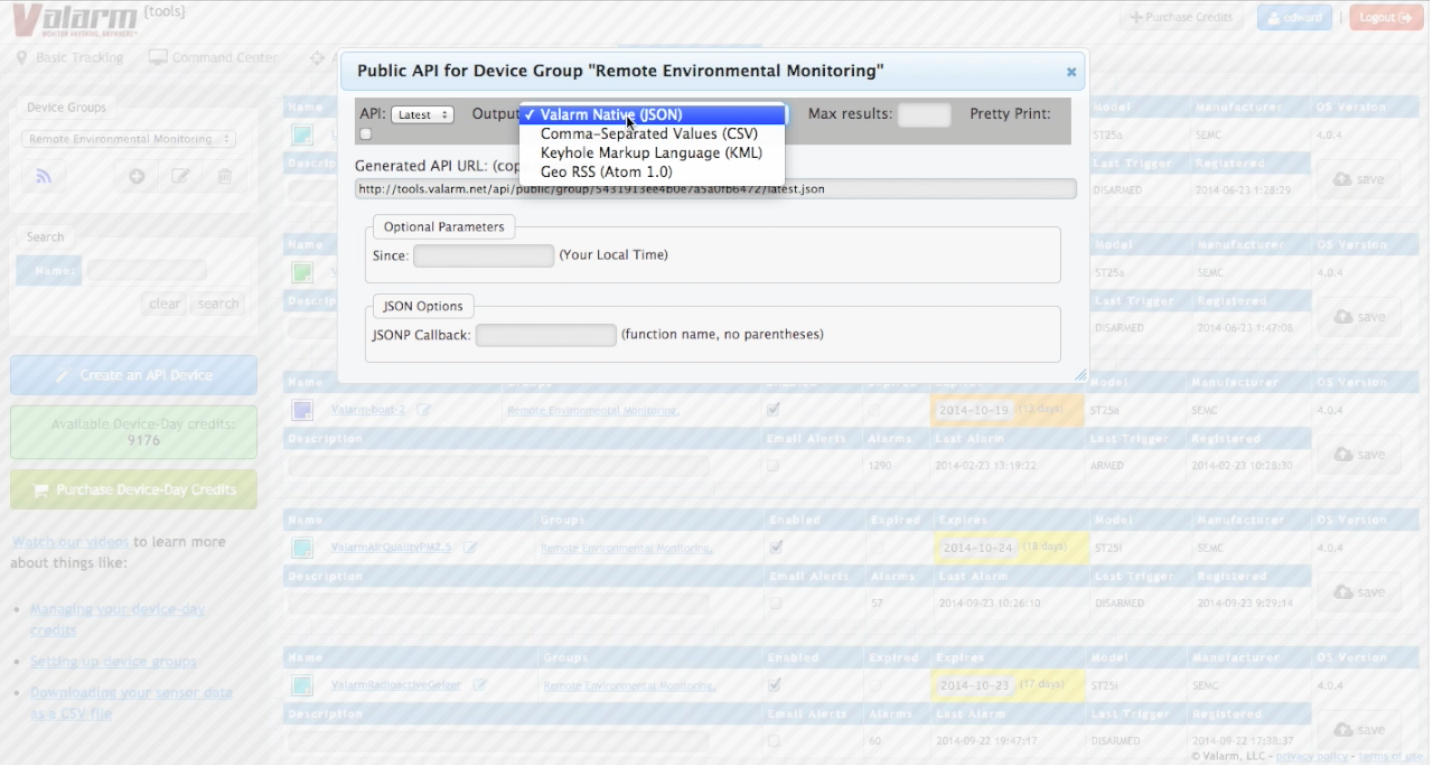
Would you like to learn more about how to use Tools.Valarm.net APIs for your groups of [...]
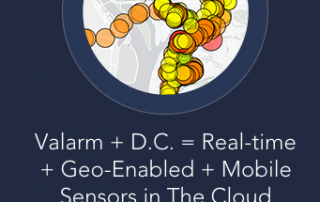
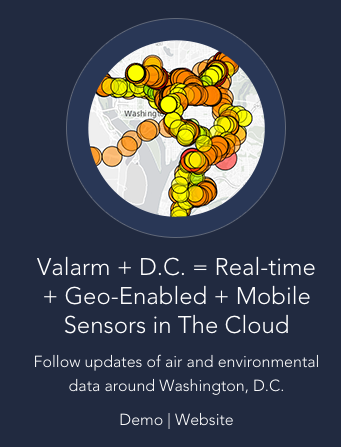
Do you want to put your real-time, mobile Industrial IoT sensor information on an [...]
This spring Valarm did a live sensor demo on stage in the plenary at [...]
Valarm and Esri will present a mobile sensors workshop at the AGILE 2014 conference [...]

 Gallery
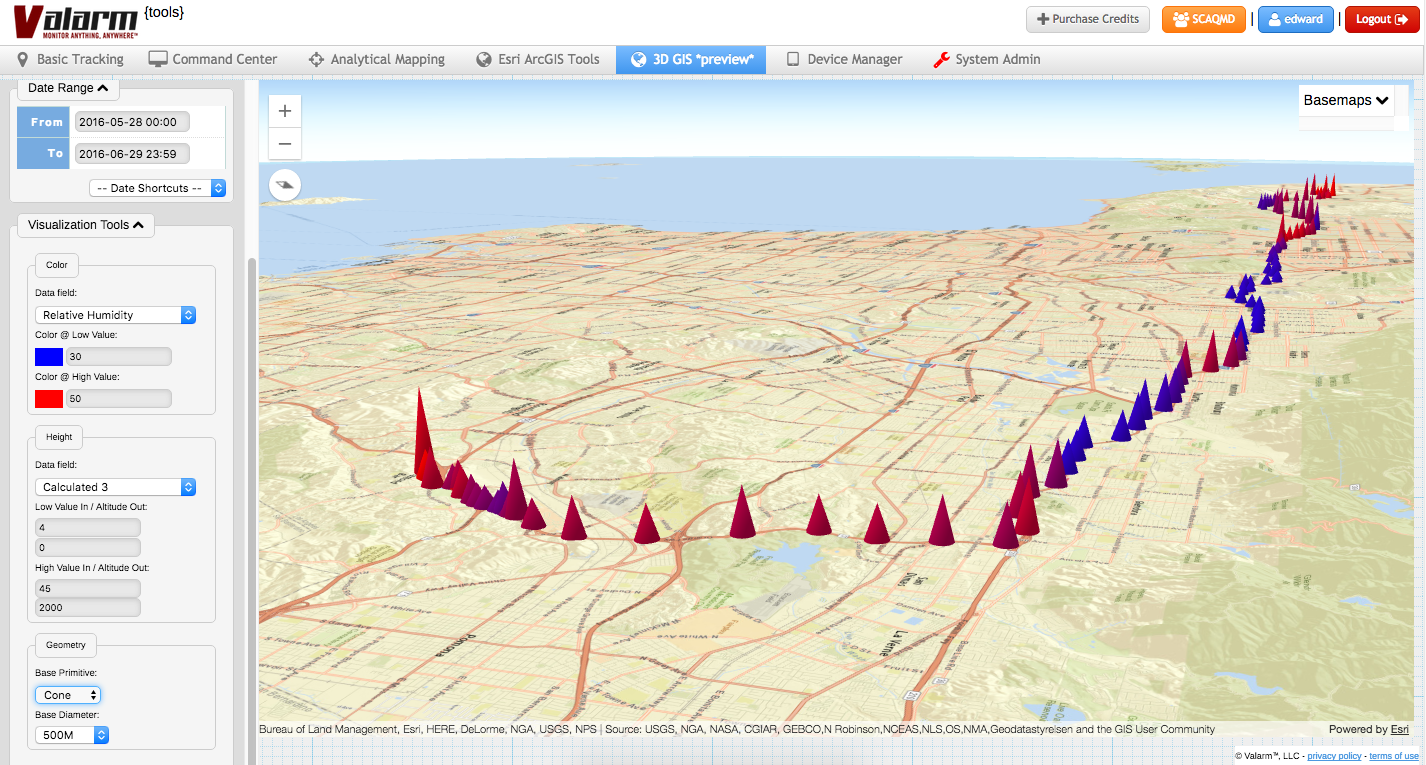


 Gallery

 Gallery


 Gallery

 Gallery
 Gallery


 Gallery
 Gallery


