Gallery
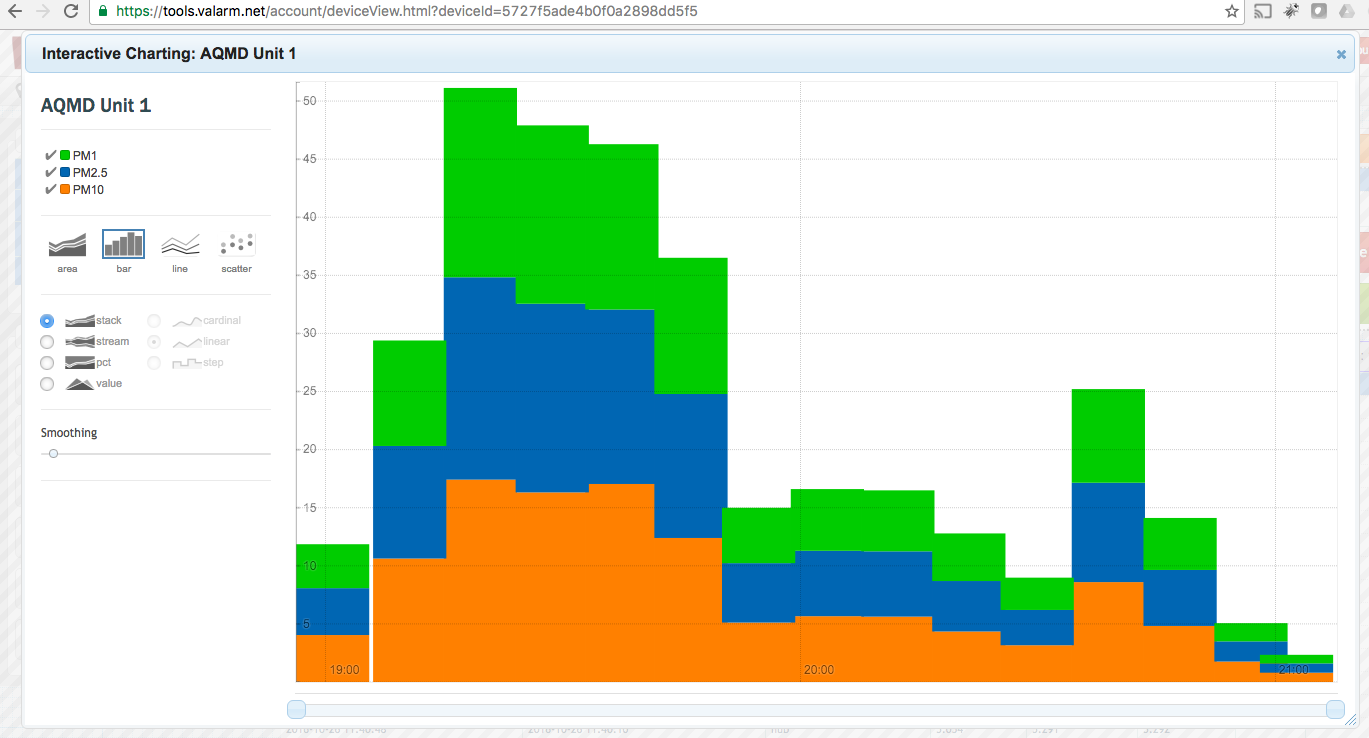

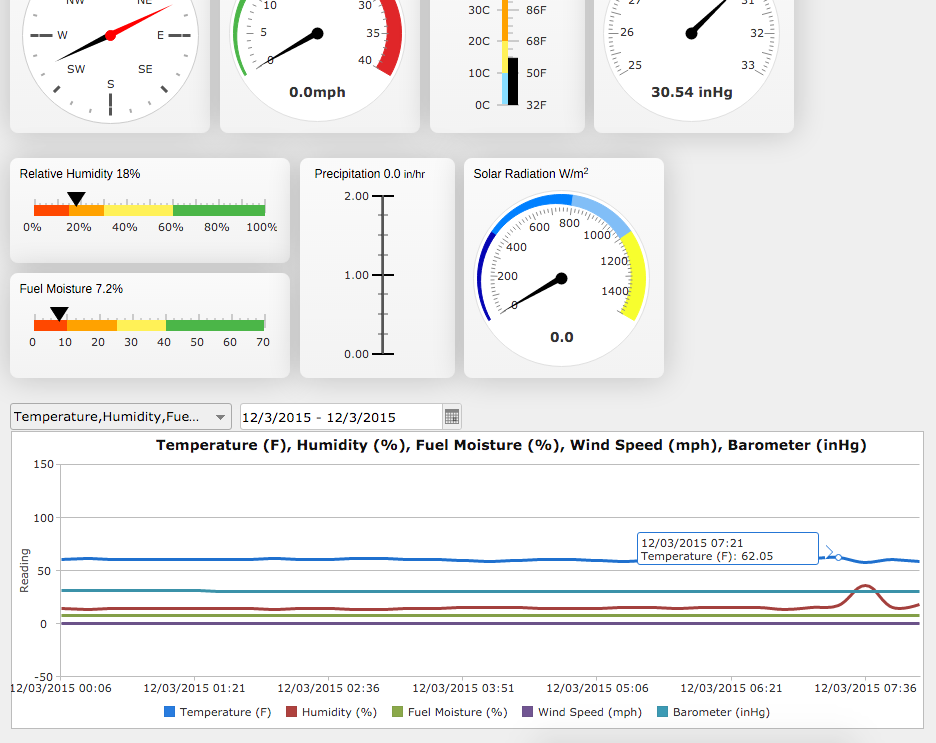
Tools.Valarm.net Does Interactive Charting & Graphing for Remotely Monitoring + Visualizing Your Organization’s Industrial IoT Sensors
Looking for an awesome way to graph, chart, and visualize your organization’s Industrial IoT [...]


Looking for an awesome way to graph, chart, and visualize your organization’s Industrial IoT [...]
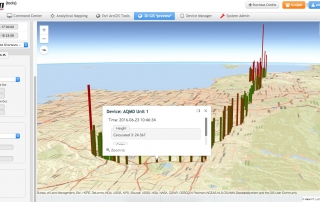
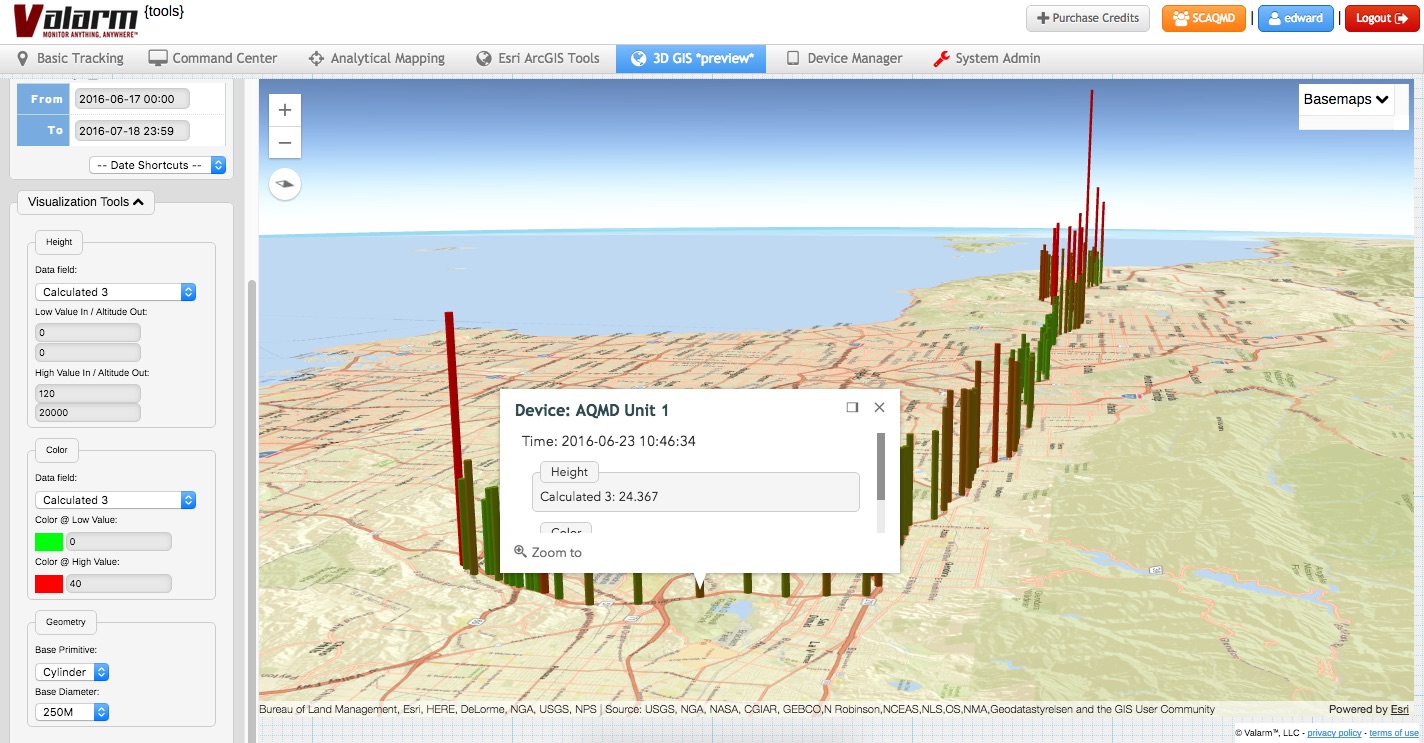
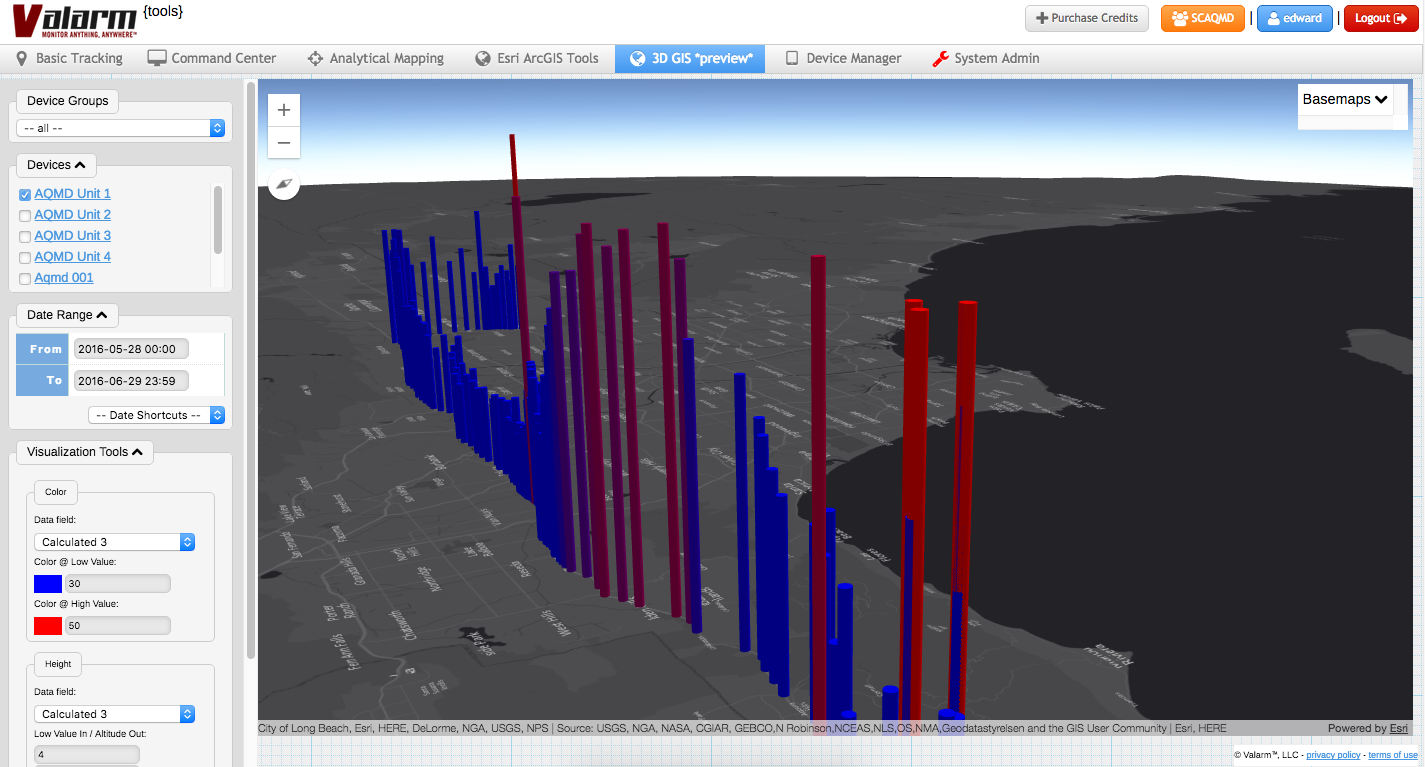
3D GIS Earth Globe Map Visualizations Meet Industrial IoT, Remote Sensor Monitoring, and Real-Time, [...]


Do you, your teams, or your organization need easy-to-use, web-based dashboards to quickly show [...]
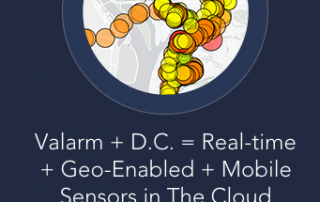
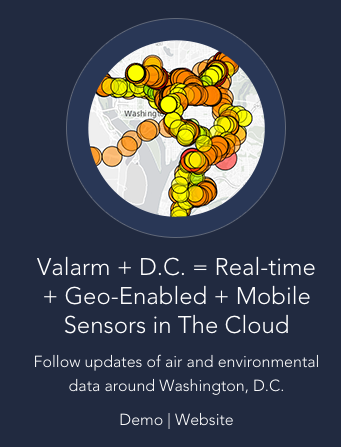
We submitted an entry this spring for the Esri Data Viz App Challenge that [...]
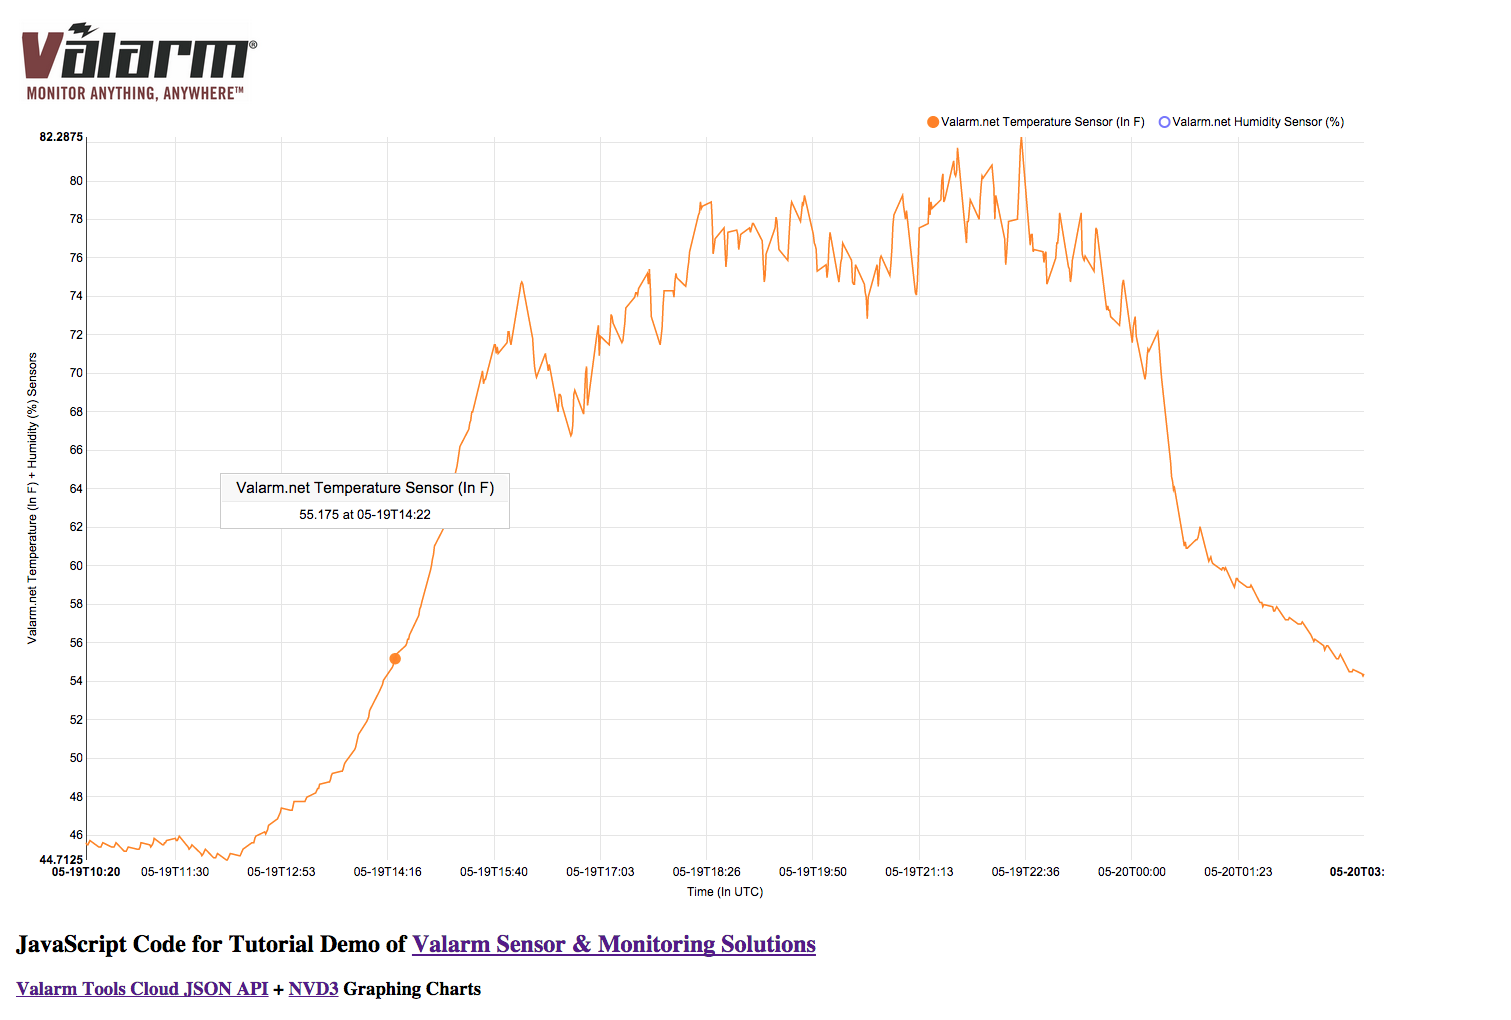
You want an easy way to graph your real-time, remote sensor data on your [...]
 Gallery


 Gallery

 Gallery


 Gallery